import seaborn as sns
import pandas as pd
from sklearn.preprocessing import StandardScaler
from sklearn.decomposition import PCA
import matplotlib.pyplot as pltAE 16: Principal component analysis
Suggested answers
Application exercise
Answers
In this application exercise, we will:
Learn about Principal Component Analysis.
Load the Penguins Dataset: Import and explore the dataset to understand its structure and the features available for analysis.
Preprocess the Data: Clean the data by handling missing values and standardize the numerical features for PCA.
Perform PCA: Apply Principal Component Analysis to reduce the dimensionality of the data and extract the principal components.
Visualize the PCA Result: Create a scatter plot of the principal components to visualize the clustering of different penguin species.
Learn about PCA
Exercise 1
Watch this video on Principal Component Analysis:
- What were three takeaways from this video? Include how you think linear algebra contributes to PCA:
Answer will vary.
PCA in Python
Packages
We will primarily use the seaborn and sklearn packages.
Exercise 2
Load the Penguins Dataset using seaborn
import seaborn as sns
import pandas as pd

penguins = sns.load_dataset('penguins')

print(penguins.head())
species island bill_length_mm bill_depth_mm flipper_length_mm \
0 Adelie Torgersen 39.1 18.7 181.0
1 Adelie Torgersen 39.5 17.4 186.0
2 Adelie Torgersen 40.3 18.0 195.0
3 Adelie Torgersen NaN NaN NaN
4 Adelie Torgersen 36.7 19.3 193.0
body_mass_g sex
0 3750.0 Male
1 3800.0 Female
2 3250.0 Female
3 NaN NaN
4 3450.0 Female Exercise 3
Preprocess the data
We need to handle missing values and select the numerical features for PCA.
penguins.dropna(inplace=True)

features = ['bill_length_mm', 'bill_depth_mm', 'flipper_length_mm', 'body_mass_g']
X = penguins[features]

from sklearn.preprocessing import StandardScaler
scaler = StandardScaler()
X_scaled = scaler.fit_transform(X)
Exercise 4
Perform PCA
Use PCA from sklearn to reduce the dimensionality of the data. Hint: use two principal components
from sklearn.decomposition import PCA

pca = PCA(n_components=2)

principal_components = pca.fit_transform(X_scaled)

pca_df = pd.DataFrame(data=principal_components, columns=['PC1', 'PC2'])

pca_df['species'] = penguins['species']
Exercise 5
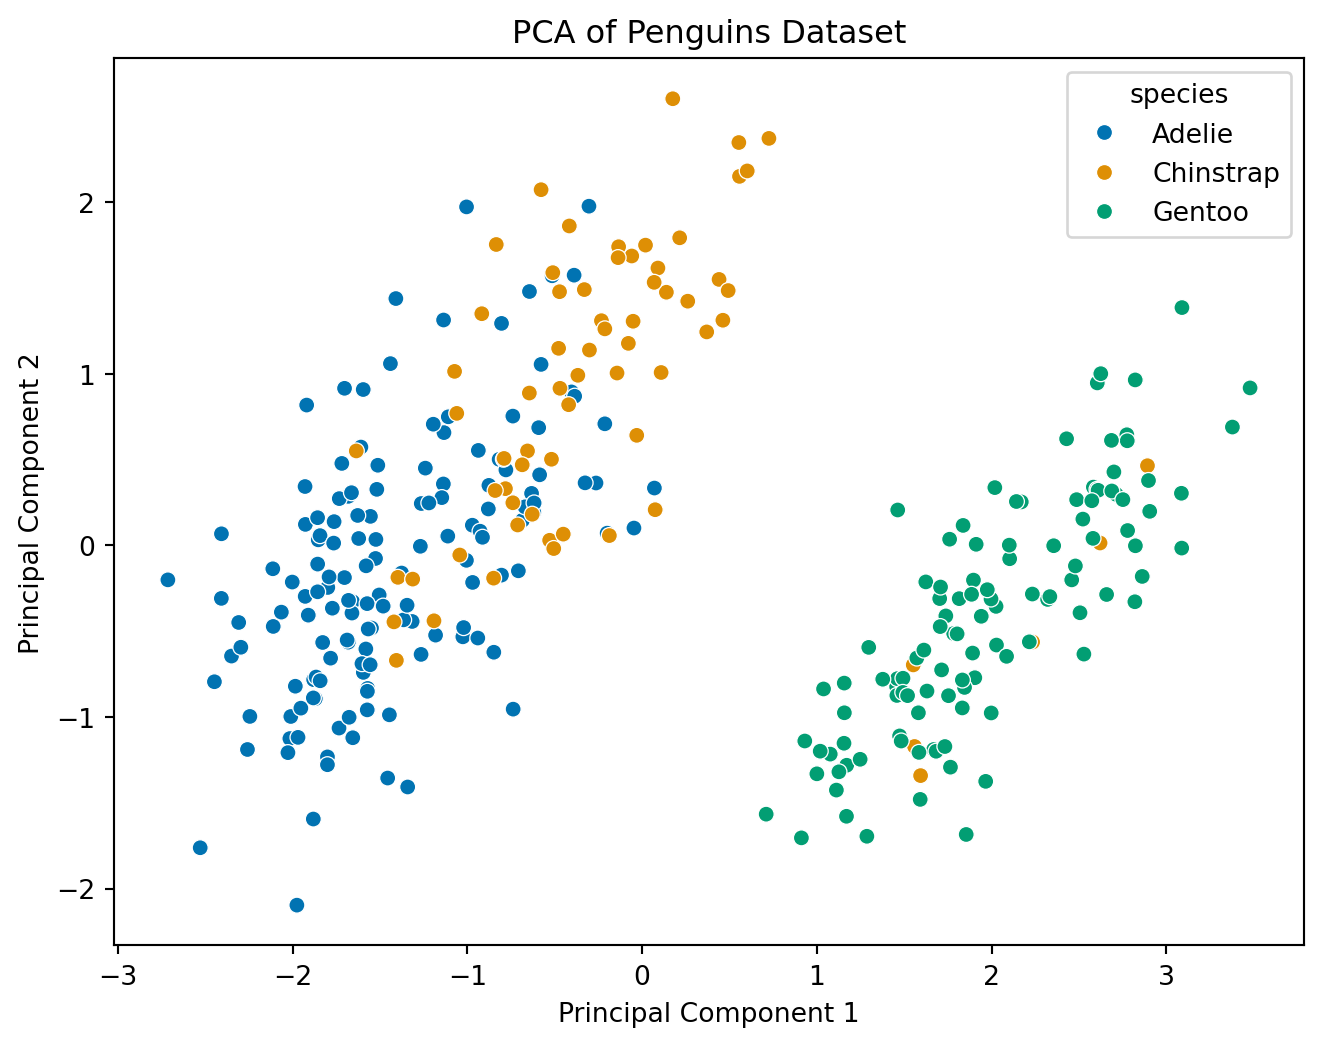
Visualize the PCA Result
Use seaborn to visualize the principal components.
plt.figure(figsize=(8, 6))
sns.scatterplot(data=pca_df, x='PC1', y='PC2', hue='species', palette='colorblind')
plt.title('PCA of Penguins Dataset')
plt.xlabel('Principal Component 1')
plt.ylabel('Principal Component 2')
plt.show()