import pandas as pd
import matplotlib.pyplot as plt
import seaborn as sns
import reAE 06: Opinion articles in The Arizona Daily Wildcat
Suggested answers
Application exercise
Answers
Important
These are suggested answers. This document should be used as reference only, it’s not designed to be an exhaustive key.
Part 1 - Data scraping
See wildcat-scrape.py for suggested scraping code.
Part 2 - Data analysis
Let’s start by loading the packages we will need:
- Load the data you saved into the
datafolder and name itwildcat.
wildcat = pd.read_csv("data/wildcat.csv")- Who are the most prolific authors of the 100 most recent opinion articles in The Arizona Daily Wildcat?
author_counts = wildcat['author'].value_counts().reset_index()
author_counts.columns = ['author', 'count']
print(author_counts)
author count
0 Greg Castro 35
1 Toni Marcheva 31
2 Apoorva Bhaskara 28
3 Alec Scott 26
4 Sean Fagan 24
.. ... ...
183 Jack Cooper 1
184 Amit Syal 1
185 Quinn McVeigh 1
186 Eric Wise 1
187 Gabriel Schivone 1
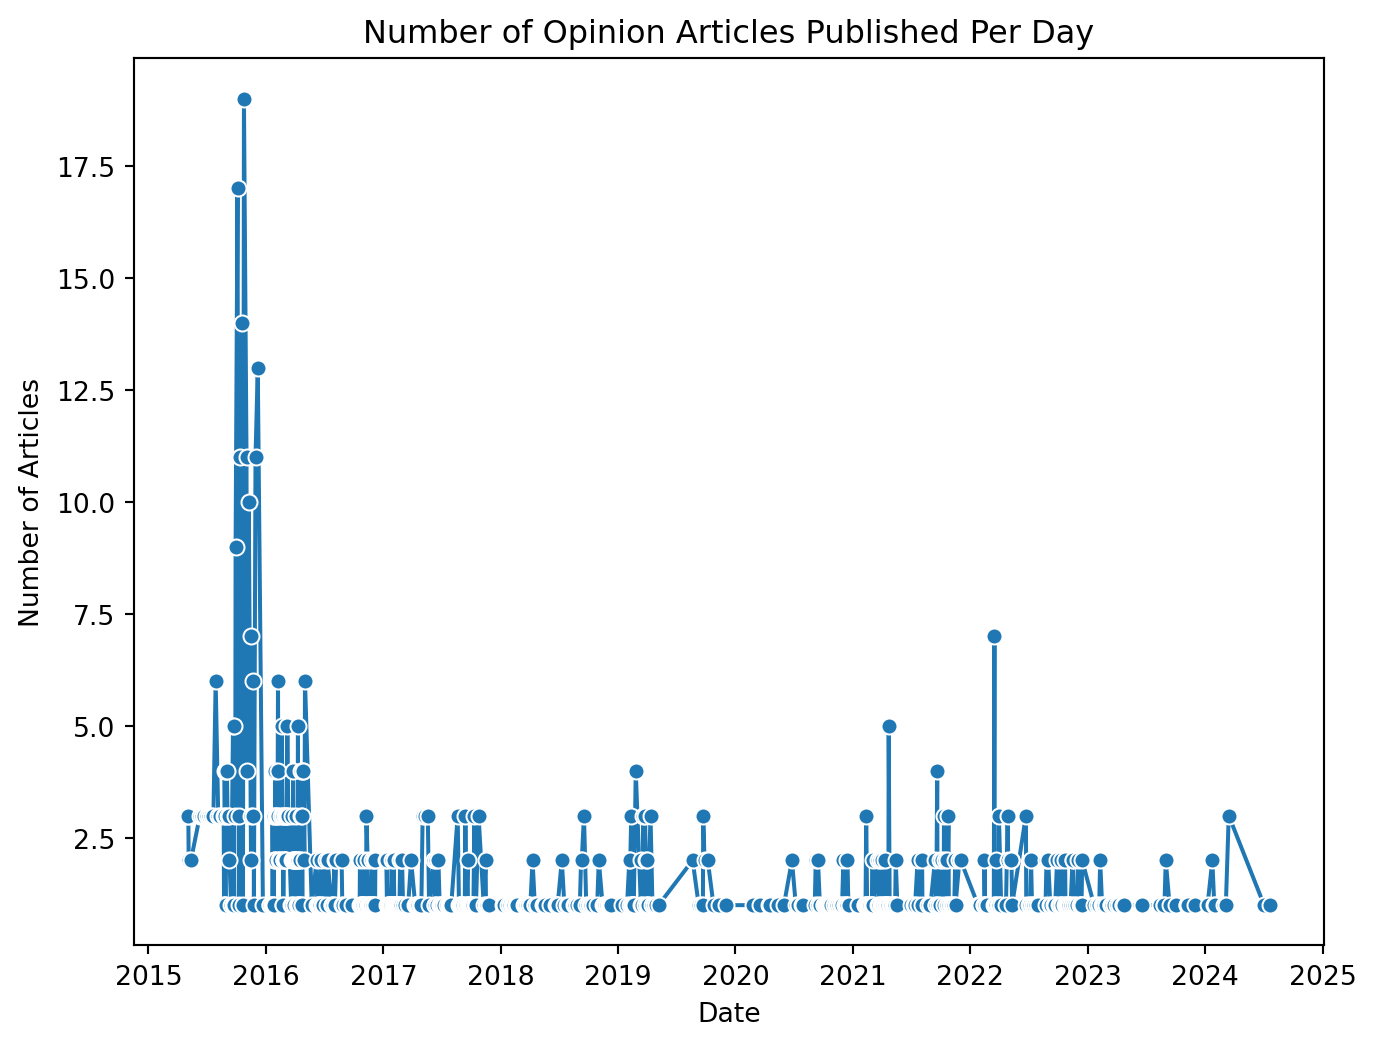
[188 rows x 2 columns]- Draw a line plot of the number of opinion articles published per day in The Arizona Daily Wildcat.
wildcat['date'] = pd.to_datetime(wildcat['date'])

articles_per_day = wildcat['date'].value_counts().sort_index().reset_index()
articles_per_day.columns = ['date', 'count']

plt.figure(figsize=(8, 6))
sns.lineplot(data=articles_per_day, x='date', y='count', marker='o')
plt.title('Number of Opinion Articles Published Per Day')
plt.xlabel('Date')
plt.ylabel('Number of Articles')
plt.show()
- What percent of the most recent 100 opinion articles in The Arizona Daily Wildcat mention “climate” in their title?
most_recent_100 = wildcat.head(100)

most_recent_100['title_lower'] = most_recent_100['title'].str.lower()
most_recent_100['climate_mentioned'] = most_recent_100['title_lower'].apply(lambda x: 'mentioned' if 'climate' in x else 'not mentioned')

climate_mentions = most_recent_100['climate_mentioned'].value_counts(normalize=True).reset_index()
climate_mentions.columns = ['climate_mentioned', 'percentage']
print(climate_mentions)
climate_mentioned percentage
0 not mentioned 0.99
1 mentioned 0.01- What percent of the most recent 100 opinion articles in The Arizona Daily Wildcat mention “election” in their title or abstract?
most_recent_100 = wildcat.head(100)

most_recent_100['title_lower'] = most_recent_100['title'].str.lower()
most_recent_100['election_mentioned'] = most_recent_100['title_lower'].apply(lambda x: 'mentioned' if 'election' in x else 'not mentioned')

climate_mentions = most_recent_100['election_mentioned'].value_counts(normalize=True).reset_index()
climate_mentions.columns = ['election_mentioned', 'percentage']
print(climate_mentions)
election_mentioned percentage
0 not mentioned 1.0- What are the most common words in the titles of the 100 most recent articles?
from nltk.corpus import stopwords
from nltk.tokenize import word_tokenize
from collections import Counter
import nltk

nltk.download('stopwords')
nltk.download('punkt')

stop_words = set(stopwords.words('english'))

most_recent_100['tokens'] = most_recent_100['title_lower'].apply(lambda x: [word for word in word_tokenize(x) if word.isalpha() and word not in stop_words])

# Count the frequency of each word
word_freq = Counter([word for tokens in most_recent_100['tokens'] for word in tokens])

# Convert to DataFrame and plot
word_freq_df = pd.DataFrame(word_freq.most_common(20), columns=['word', 'count'])

plt.figure(figsize=(8, 6))
sns.barplot(data=word_freq_df, x='count', y='word', palette='viridis')
plt.title('Most Common Words in Titles of 100 Most Recent Articles')
plt.xlabel('Count')
plt.ylabel('Word')
plt.show()
- Time permitting:
