AE 02: Diwali sales + EDA

Suggested answers

Application exercise
Answers

Exercise 1

Reading and Examining the Data

  1. Read in the data:

    • Read the Diwali sales data into a Pandas DataFrame and display the first few rows.
    • Hint: use , encoding = 'iso-8859-1' within the pd.___() function.
import pandas as pd

# Read in the data
diwali = pd.read_csv('data/diwali_sales_data.csv', encoding='iso-8859-1')
diwali.head()
User_ID Cust_name Product_ID Gender Age Group Age Marital_Status State Zone Occupation Product_Category Orders Amount
0 1002903 Sanskriti P00125942 F 26-35 28 0 Maharashtra Western Healthcare Auto 1 23952.0
1 1000732 Kartik P00110942 F 26-35 35 1 Andhra Pradesh Southern Govt Auto 3 23934.0
2 1001990 Bindu P00118542 F 26-35 35 1 Uttar Pradesh Central Automobile Auto 3 23924.0
3 1001425 Sudevi P00237842 M 0-17 16 0 Karnataka Southern Construction Auto 2 23912.0
4 1000588 Joni P00057942 M 26-35 28 1 Gujarat Western Food Processing Auto 2 23877.0
  1. Examine the Data:
    • Display basic information about the dataset using the .info() method.

    • Display summary statistics for the numerical columns using the .describe() method.

# Examine the data
diwali.info()

# Describe numerical columns
diwali.describe()
<class 'pandas.core.frame.DataFrame'>
RangeIndex: 11251 entries, 0 to 11250
Data columns (total 13 columns):
 #   Column            Non-Null Count  Dtype  
---  ------            --------------  -----  
 0   User_ID           11251 non-null  int64  
 1   Cust_name         11251 non-null  object 
 2   Product_ID        11251 non-null  object 
 3   Gender            11251 non-null  object 
 4   Age Group         11251 non-null  object 
 5   Age               11251 non-null  int64  
 6   Marital_Status    11251 non-null  int64  
 7   State             11251 non-null  object 
 8   Zone              11251 non-null  object 
 9   Occupation        11251 non-null  object 
 10  Product_Category  11251 non-null  object 
 11  Orders            11251 non-null  int64  
 12  Amount            11239 non-null  float64
dtypes: float64(1), int64(4), object(8)
memory usage: 1.1+ MB
User_ID Age Marital_Status Orders Amount
count 1.125100e+04 11251.000000 11251.000000 11251.000000 11239.000000
mean 1.003004e+06 35.421207 0.420318 2.489290 9453.610858
std 1.716125e+03 12.754122 0.493632 1.115047 5222.355869
min 1.000001e+06 12.000000 0.000000 1.000000 188.000000
25% 1.001492e+06 27.000000 0.000000 1.500000 5443.000000
50% 1.003065e+06 33.000000 0.000000 2.000000 8109.000000
75% 1.004430e+06 43.000000 1.000000 3.000000 12675.000000
max 1.006040e+06 92.000000 1.000000 4.000000 23952.000000

Add narrative here…

Important

Now is a good time to render, commit, and push. Make sure that you commit and push all changed documents and your Git pane is completely empty before proceeding.

Exercise 2

Exploring unique levels, outliers, and missing values

  1. Exploring Unique Levels:

    • Identify and display the unique values in each categorical column.
# Select categorical columns
categorical_cols = diwali.select_dtypes(include=['object']).columns

# Display unique levels for each categorical column
for col in categorical_cols:
    print(f"Unique levels in {col}: {diwali[col].unique()}")
Unique levels in Cust_name: ['Sanskriti' 'Kartik' 'Bindu' ... 'Chris' 'Madan Mohan' 'Nicole']
Unique levels in Product_ID: ['P00125942' 'P00110942' 'P00118542' ... 'P00307142' 'P00044742'
 'P00296942']
Unique levels in Gender: ['F' 'M']
Unique levels in Age Group: ['26-35' '0-17' '18-25' '55+' '46-50' '51-55' '36-45']
Unique levels in State: ['Maharashtra' 'Andhra Pradesh' 'Uttar Pradesh' 'Karnataka' 'Gujarat'
 'Himachal Pradesh' 'Delhi' 'Madhya Pradesh' 'Jharkhand' 'Kerala'
 'Haryana' 'Bihar' 'Rajasthan' 'Uttarakhand' 'Telangana' 'Punjab']
Unique levels in Zone: ['Western' 'Southern' 'Central' 'Northern' 'Eastern']
Unique levels in Occupation: ['Healthcare' 'Govt' 'Automobile' 'Construction' 'Food Processing'
 'Lawyer' 'IT Sector' 'Media' 'Banking' 'Retail' 'Hospitality' 'Aviation'
 'Agriculture' 'Textile' 'Chemical']
Unique levels in Product_Category: ['Auto' 'Hand & Power Tools' 'Stationery' 'Tupperware' 'Footwear & Shoes'
 'Furniture' 'Food' 'Games & Toys' 'Sports Products' 'Books'
 'Electronics & Gadgets' 'Decor' 'Clothing & Apparel' 'Beauty'
 'Household items' 'Pet Care' 'Veterinary' 'Office']
  1. Identifying and Visualizing Outliers:

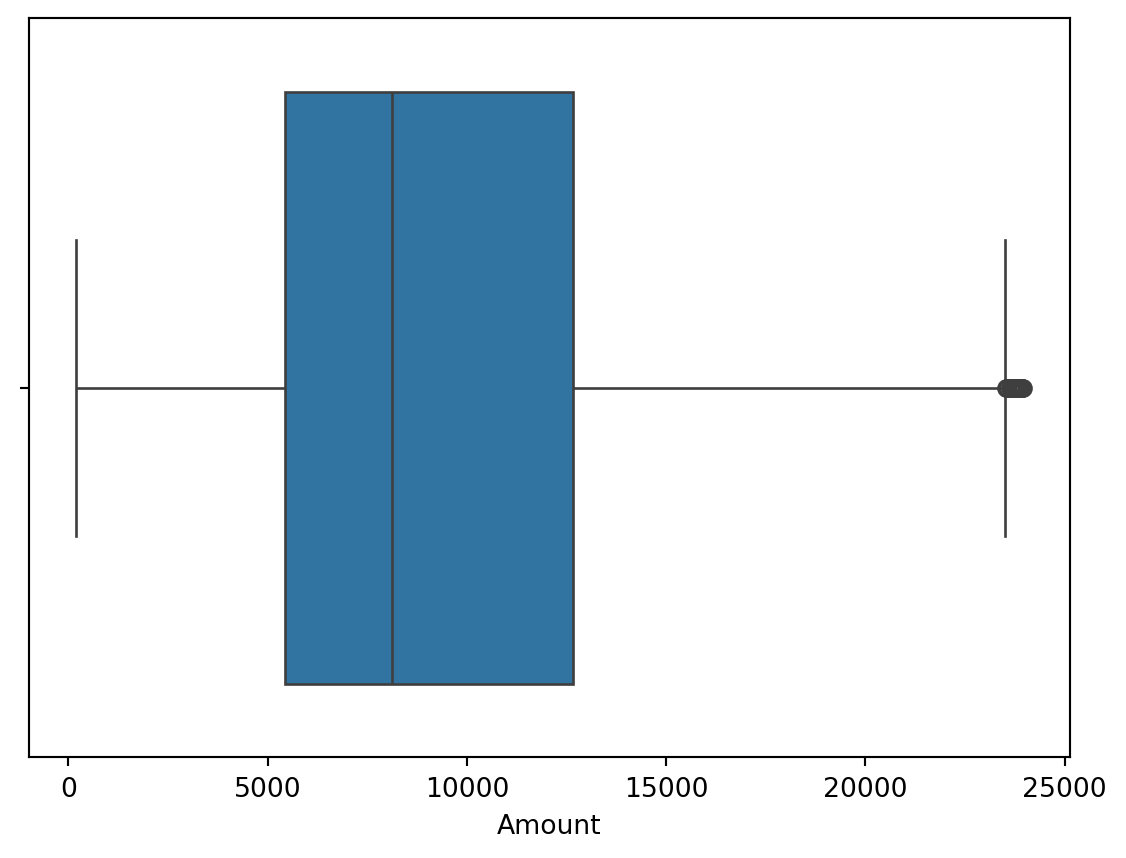
    • Create a box plot to visualize outliers in the ‘Amount’ column.

    • Identify outliers using the IQR method and count the number of outliers for each numerical column.

import seaborn as sns
import matplotlib.pyplot as plt

# Boxplot to visualize outliers
sns.boxplot(data=diwali, x='Amount')
plt.show()

# Identify outliers using the IQR method
for col in diwali.select_dtypes(include='number').columns:
    q25 = diwali[col].quantile(0.25)
    q75 = diwali[col].quantile(0.75)
    iqr = q75 - q25
    lower_bound = q25 - 1.5 * iqr
    upper_bound = q75 + 1.5 * iqr
    outliers = diwali[(diwali[col] < lower_bound) | (diwali[col] > upper_bound)]
    print(f"{col}: {outliers.shape[0]} outliers")

User_ID: 0 outliers
Age: 283 outliers
Marital_Status: 0 outliers
Orders: 0 outliers
Amount: 19 outliers
  1. Handling Missing Values:

    • Check for missing values in the dataset.
# Check for missing values
diwali.isnull().sum()
User_ID              0
Cust_name            0
Product_ID           0
Gender               0
Age Group            0
Age                  0
Marital_Status       0
State                0
Zone                 0
Occupation           0
Product_Category     0
Orders               0
Amount              12
dtype: int64

Add narrative here…

Important

Now is a good time to render, commit, and push. Make sure that you commit and push all changed documents and your Git pane is completely empty before proceeding.