Communicating data science results effectively
University of Arizona
INFO 511
Communicating data science results effectively
Project
Review peer evaluations left by your peers, implement updates as you see fit, close the issue once you review them.
Have a clear plan for who is doing what, open issues on your repo, and assign them to individuals who can then close the issues as they finish a task.
Schedule at least one team meeting between today and your presentation to practice your presentation together.
Any project questions?
Effective communication
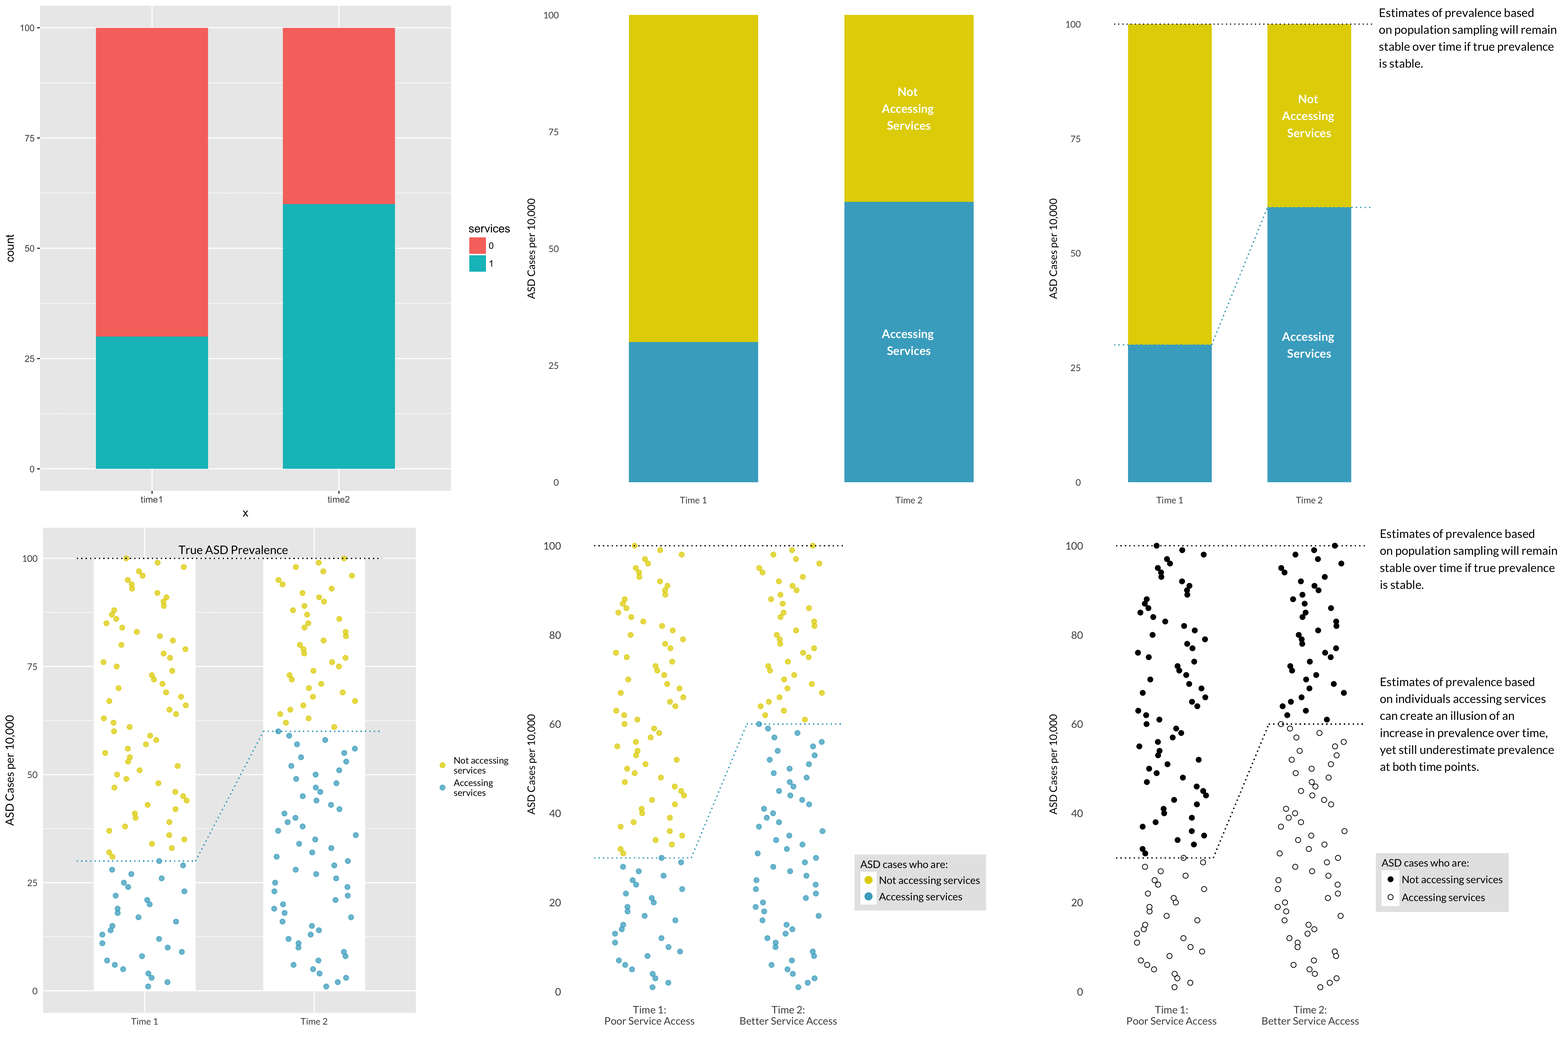
Take A Sad Plot & Make It Better

Recap of data viz
- Represent percentages as parts of a whole
- Place variables representing time on the x-axis when possible
- Pay attention to data types, e.g., represent time as time on a continuous scale, not years as levels of a categorical variable
- Prefer direct labeling over legends
- Use accessible colors
- Use color to draw attention
- Pick a purpose and label, color, annotate for that purpose
- Communicate your main message directly in the plot labels
- Simplify before you call it done (a.k.a. “Before you leave the house, look in the mirror and take one thing off”)
Quarto reports and presentations
Project presentations due Dec 18! 🥳
Make sure your presentation is pushed to your GitHub repo before the due date.
All team members must take part in the presentation
Record your 10-minute presentation – you’ll lose 1 point/ minute over 10.
Fill out feedback forms while you listen to others’ presentations.
Project write-ups due Dec 20
There’s a good chance you’ll be done with these on Monday as well
But you might want to improve your write-up based on inspiration from other teams’ presentations and/or ideas that came up during your peer-reviews.
Expectations
The goal of this project is for you to demonstrate proficiency in the techniques we have covered in this class (and beyond, if you like) and apply them to a novel dataset in a meaningful way.
Beyond, if you like – “you” is the whole team!
Expectations
The goal is not to do an exhaustive data analysis i.e., do not calculate every statistic and procedure you have learned for every variable, but rather let me know that you are proficient at asking meaningful questions and answering them with results of data analysis, that you are proficient in using Python, and that you are proficient at interpreting and presenting the results.
Requirements
Focus on methods that help you begin to answer your research questions. You do not have to apply every statistical procedure we learned.
Tip
Critique your own methods and provide suggestions for improving your analysis. Discuss issues pertaining to the reliability and validity of your data, and appropriateness of the statistical analysis.
Tip
You can critique the current research without talking about a hypothetical future research.
How many plots
You do not need to visualize all of the data at once. A single high-quality visualization will receive a much higher grade than a large number of poor-quality visualizations.
There is no specific, secret number of visualizations I’m expecting, the right number is the number that it takes to answer your question.
Submission
Submission of these deliverables will happen on GitHub and feedback will be provided as GitHub issues that you need to engage with and close. The collection of the documents in your GitHub repo will create a webpage for your project. To create the webpage go to VS Code, open a terminal and type
quarto publish gh-pagesor if you have published via Quarto Pubs `quarto publish quarto-pub
Writeup
- Is there any paper that is required as well as the presentation?
- What is the project write up?
- Are write ups usually around the 10 page limit?
- Is there a recommended outline to the project?
Grading / rubric
Your project write-up with Quarto
Chunk options around what makes it in your final report:
message,echo, etc.Citations.
Finalizing your report with
echo: false.
Building your project website with Quarto
The
_sitefolder.Making sure your website reflects your latest changes.
Customizing the look of your website.
Slides
Option 1: Make your slides not in Quarto but make sure they’re available in your Quarto project website.
Option 2: Make your slides with Quarto.
Something else 💛
I have enjoyed this semester, and I want to continue learning Python. What classes do you recommend I take to continue my learning?
INFO 523: Data Mining and Discovery - Python essentially for applied ML
INFO 521: Intro to Machine Learning - Python as a part of the ML curriculum
