import pandas as pd
import numpy as np
import statsmodels.api as sm
import statsmodels.formula.api as smf
from sklearn.model_selection import train_test_split, KFold
from sklearn.metrics import mean_squared_error
import matplotlib.pyplot as plt
import seaborn as sns

sns.set_theme(style="whitegrid", rc={"figure.figsize": (8, 6), "axes.labelsize": 16, "xtick.labelsize": 14, "ytick.labelsize": 14})Model validation
Lecture 19
University of Arizona
INFO 511
Setup
Data: Candy Rankings
<class 'pandas.core.frame.DataFrame'>
RangeIndex: 85 entries, 0 to 84
Data columns (total 13 columns):
 #   Column            Non-Null Count  Dtype
---  ------            --------------  -----
 0   competitorname    85 non-null     object
 1   chocolate         85 non-null     bool
 2   fruity            85 non-null     bool
 3   caramel           85 non-null     bool
 4   peanutyalmondy    85 non-null     bool
 5   nougat            85 non-null     bool
 6   crispedricewafer  85 non-null     bool
 7   hard              85 non-null     bool
 8   bar               85 non-null     bool
 9   pluribus          85 non-null     bool
 10  sugarpercent      85 non-null     float64
 11  pricepercent      85 non-null     float64
 12  winpercent        85 non-null     float64
dtypes: bool(9), float64(3), object(1)
memory usage: 3.5+ KB
Model validation
Overfitting
The data we are using to construct our models come from a larger population.
Ultimately we want our model to tell us how the population works, not just the sample we have.
If the model we fit is too tailored to our sample, it might not perform as well with the remaining population. This means the model is “overfitting” our data.
We measure this using model validation techniques.
Note: Overfitting is not a huge concern with linear models with low level interactions, however it can be with more complex and flexible models. The following is just an example of model validation, even though we’re using it in a scenario where the concern for overfitting is not high.
Model validation
One commonly used model validation technique is to partition your data into training and testing set
That is, fit the model on the training data
And test it on the testing data
Evaluate model performance using \(RMSE\), root-mean squared error
\[ RMSE = \sqrt{\frac{\sum_{i = 1}^n (y_i - \hat{y}_i)^2}{n}} \]
Do you think we should prefer low or high RMSE?
Random sampling and reproducibility
Gotta set a seed!
Use different seeds from each other
Need inspiration? https://www.random.org/
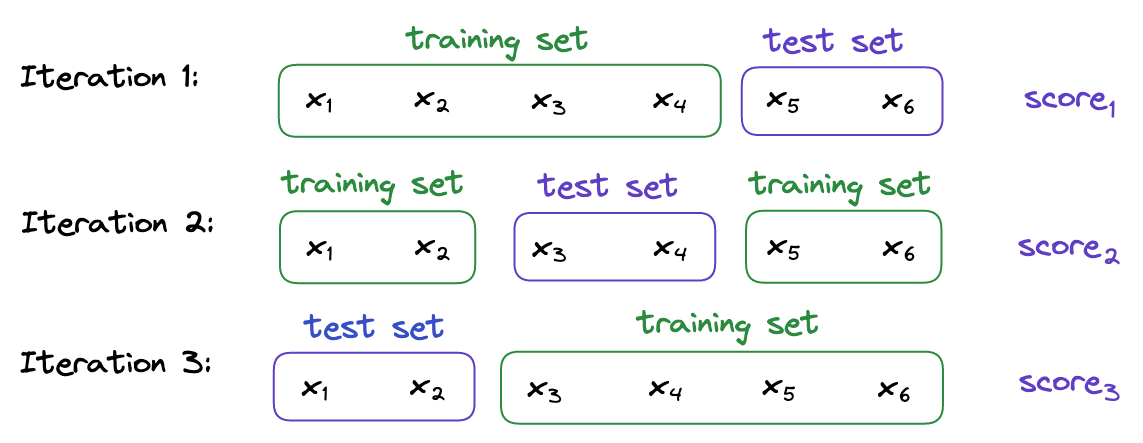
Cross validation
More specifically, k-fold cross validation
Split your data into k folds.
Use 1 fold for testing and the remaining (k - 1) folds for training.
Repeat k times.

Prepping your data for 5-fold CV
candy_rankings['id'] = np.arange(len(candy_rankings))
candy_rankings = candy_rankings.sample(frac=1).reset_index(drop=True)
candy_rankings['fold'] = (np.arange(len(candy_rankings)) % 5) + 1

candy_rankings_cv = candy_rankings.groupby('fold').size().reset_index(name='count')
print(candy_rankings_cv)
fold count
0 1 17
1 2 17
2 3 17
3 4 17
4 5 17CV 1
test_fold = 1
test = candy_rankings[candy_rankings['fold'] == test_fold]
train = candy_rankings[candy_rankings['fold'] != test_fold]

model = smf.ols('winpercent ~ chocolate + fruity + peanutyalmondy + crispedricewafer + hard + sugarpercent', data=train).fit()
rmse_test1 = np.sqrt(mean_squared_error(test['winpercent'], model.predict(test)))
print(f'RMSE Test 1: {rmse_test1}')
RMSE Test 1: 10.150090060666065RMSE on training vs. testing
Would you expect the RMSE to be higher for your training data or your testing data? Why?
RMSE on training vs. testing
RMSE for testing:
rmse_test1 = np.sqrt(mean_squared_error(test['winpercent'], model.predict(test)))
print(f'RMSE Test 1: {rmse_test1}')
RMSE Test 1: 10.150090060666065RMSE for training:
CV 2
rmse_test2 = np.sqrt(mean_squared_error(test['winpercent'], model.predict(test)))
rmse_train2 = np.sqrt(mean_squared_error(train['winpercent'], model.predict(train)))
print(f'RMSE Test 2: {rmse_test2}')
print(f'RMSE Train 2: {rmse_train2}')
RMSE Test 2: 10.432240639004076
RMSE Train 2: 10.027804484574574CV 3
rmse_test3 = np.sqrt(mean_squared_error(test['winpercent'], model.predict(test)))
rmse_train3 = np.sqrt(mean_squared_error(train['winpercent'], model.predict(train)))
print(f'RMSE Test 3: {rmse_test3}')
print(f'RMSE Train 3: {rmse_train3}')
RMSE Test 3: 11.958503120070844
RMSE Train 3: 9.801042089669558CV 4
rmse_test4 = np.sqrt(mean_squared_error(test['winpercent'], model.predict(test)))
rmse_train4 = np.sqrt(mean_squared_error(train['winpercent'], model.predict(train)))
print(f'RMSE Test 4: {rmse_test4}')
print(f'RMSE Train 4: {rmse_train4}')
RMSE Test 4: 12.399658584874505
RMSE Train 4: 9.606463253257319CV 5
rmse_test5 = np.sqrt(mean_squared_error(test['winpercent'], model.predict(test)))
rmse_train5 = np.sqrt(mean_squared_error(train['winpercent'], model.predict(train)))
print(f'RMSE Test 5: {rmse_test5}')
print(f'RMSE Train 5: {rmse_train5}')
RMSE Test 5: 10.012905093096018
RMSE Train 5: 10.138055978824323Putting it altogether
How does RMSE compare to y?
winpercentsummary stats:
count    85.000000
mean     50.316764
std      14.714357
min      22.445341
25%      39.141056
50%      47.829754
75%      59.863998
max      84.180290
Name: winpercent, dtype: float64rmse_testsummary stats:
count     5.000000
mean     10.990679
std       1.106390
min      10.012905
25%      10.150090
50%      10.432241
75%      11.958503
max      12.399659
Name: rmse_test, dtype: float64
model_selection in scikit-learn
Cross Validation - Faster
sklearn.model_selection.KFold: Partition data into k foldsCalculate RMSEs for each of the models on the testing set
Partition data into k folds
k = 5:
Fit model on each of training set
rmses = []
for train_index, test_index in folds:
    train_data = candy_rankings.iloc[train_index]
    test_data = candy_rankings.iloc[test_index]
    model = smf.ols('winpercent ~ chocolate + fruity + peanutyalmondy + crispedricewafer + hard + sugarpercent', data=train_data).fit()
    rmse = np.sqrt(mean_squared_error(test_data['winpercent'], model.predict(test_data)))
    rmses.append(rmse)


