Intro to Probability
Lecture 11
University of Arizona
INFO 511
What we’ve done so far…
- Use visualization techniques to visualize data
- Use descriptive statistics to describe and summarize data
- Use data wrangling tools to manipulate data
- …all using the reproducible, shareable tools of Python, Jupyter, and git
That’s all great, but what we eventually want to do is to quantify uncertainty in order to make principled conclusions about the data
The statistical process
Statistics is a process that converts data into useful information, where practitioners
1️⃣ form a question of interest,
2️⃣ collect and summarize data,
3️⃣ and interpret the results.

The population of interest
The population is the group we’d like to learn something about.
What is the prevalence of diabetes among U.S. adults, and has it changed over time?
Does the average amount of caffeine vary by vendor in 12 oz. cups of coffee at U of A coffee shops?
Is there a relationship between tumor type and five-year mortality among breast cancer patients?
The research question of interest is what we want to answer - often relating one or more numerical quantities or summary statistics.
If we had data from every unit in the population, we could just calculate what we wanted and be done!
Sampling from the population
Unfortunately, we (usually) have to settle with a sample from the population.
Ideally, the sample is representative (has similar characteristics as the population), allowing us to make conclusions that are generalizable (i.e. applicable) to the broader population of interest.
We’ll use probability and statistical inference (more on this later!) to draw conclusions about the population based on our sample.
Interpreting probabilities
Interpretations of probability

“There is a 1 in 3 chance of selecting a white ball”
Interpretations of probability

“There is a 75% chance of rain tomorrow”
Interpretations of probability

“The surgery has a 50% probability of success”
Interpretations of probability

Long-run frequencies vs. degree of belief
Formalizing probabilities
What do we need?
We can think of probabilities as objects that model random phenomena. We’ll use three components to talk about probabilities:
1️⃣ Sample space: the set of all possible outcomes
2️⃣ Events: Subsets of the sample space, comprise any number of possible outcomes (including none of them!)
3️⃣ Probability: Proportion of times an event would occur if we observed the random phenomenon an infinite number of times.
Sample spaces
Sample spaces depend on the random phenomenon in question
Tossing a single fair coin
Sum of rolling two fair six-sided dice
Guessing the answer on a multiple choice question with choices a, b, c, d.
What are the sample spaces for the random phenomena above?
Events
Events are subsets of the sample space that comprise all possible outcomes from that event. These are the “plausibly reasonable” outcomes we may want to calculate the probabilities for:
Tossing a single fair coin
Sum of rolling two fair six-sided dice
Guessing the answer on a multiple choice question with choices a, b, c, d.
What are some examples of events for the random phenomena above?
Probabilities
Consider the following possible events and their corresponding probabilities:
- Getting a head from a single fair coin toss: 0.5
- Getting a prime number sum from rolling two fair six-sided dice: 5/12
- Guessing the correct answer: 1/4
We’ll talk more about how we calculated these probabilities, but for now remember that probabilities are numbers describing the likelihood of each event’s occurrence, which map events to a number between 0 and 1, inclusive.
Working with probabilities
Set operations
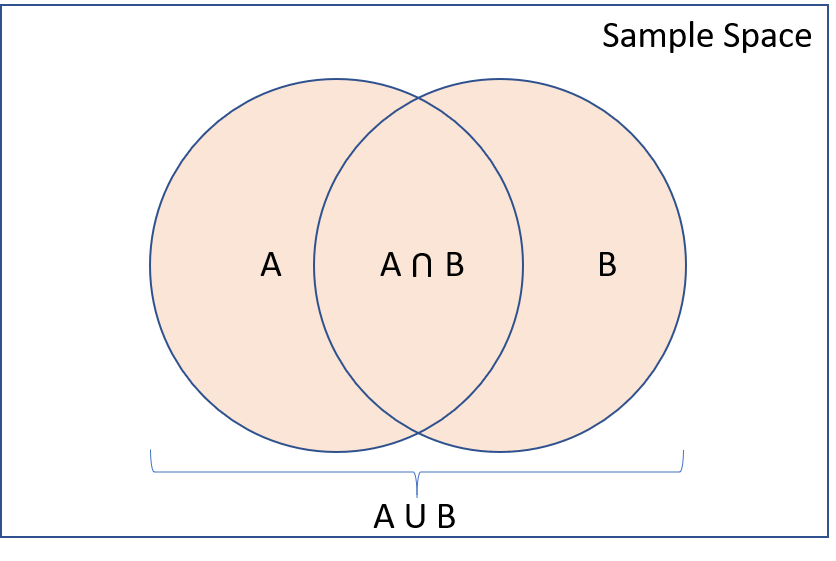
Remember that events are (sub)sets of the outcome space. For two sets (in this case events) \(A\) and \(B\), the most common relationships are:
- Intersection \((A \text{ and } B)\): \(A\) and \(B\) both occur
- Union \((A \text{ or } B)\): \(A\) or \(B\) occurs (including when both occur)
- Complement \((A^c)\): \(A\) does not occur
Two sets \(A\) and \(B\) are said to be disjoint or mutually exclusive if they cannot happen at the same time, i.e. \(A \text{ and } B = \emptyset\).
Combining set operations
DeMorgan’s laws
- Complement of union: \((A \text{ or } B)^c = A^c \text{ and } B^c\)
- Complement of intersection: \((A \text{ and } B)^c = A^c \text{ or } B^c\)
These can be extended to more than two events

How do probabilities work?
Kolmogorov axioms
✅ The probability of any event is real number that’s \(\geq 0\)
✅ The probability of the entire sample space is 1
✅ If \(A\) and \(B\) are disjoint events, then \(P(A \text{ or } B) = P(A) + P(B)\)
The Kolmogorov axioms lead to all probabilities being between 0 and 1 inclusive, and also lead to important rules…
Two important rules
Suppose we have events \(A\) and \(B\), with probabilities \(P(A)\) and \(P(B)\) of occurring. Based on the Kolmogorov axioms:
- Complement Rule: \(P(A^c) = 1 - P(A)\)
- Inclusion-Exclusion: \(P(A \text{ or } B) = P(A) + P(B) - P(A \text{ and } B)\)

Practicing with probabilities
| Did not die | Died | |
|---|---|---|
| Does not drink coffee | 5438 | 1039 |
| Drinks coffee occasionally | 29712 | 4440 |
| Drinks coffee regularly | 24934 | 3601 |
Practicing with probabilities
| Did not die | Died | |
|---|---|---|
| Does not drink coffee | 5438 | 1039 |
| Drinks coffee occasionally | 29712 | 4440 |
| Drinks coffee regularly | 24934 | 3601 |
Define events A = died and B = non-coffee drinker. Calculate the following for a randomly selected person in the cohort:
\(\small{P(A)}\)
\(\small{P(B)}\)
\(\small{P(A \text{ and } B)}\)
\(\small{P(A \text{ or } B)}\)
\(\small{P(A \text{ or } B^c)}\)
