Exam 1 review
Lecture 9
University of Arizona
INFO 511
Setup
Type coercion
Explicit vs. implicit type coercion
Explicit type coercion: You ask Python to change the type of a variable
Implicit type coercion: Python changes / makes assumptions for you about the type of a variable without you asking for it
- This happens because in a series, you can’t have multiple types of values
Vectors
A vector is a collection of values
Atomic vectors can only contain values of the same type
Lists can contain values of different types
Why do we care? Because each column of a data frame is a vector.
Explicit coercion
✅ From numeric to character
Explicit coercion
❌ From character to numeric
Implicit coercion
Which of the column types were implicitly coerced?
Collecting data
Suppose you conduct a survey and ask students their student ID number and number of credits they’re taking this semester. What is the type of each variable?
Cleaning data
survey = survey_raw.copy()
survey['student_id'] = survey['student_id'].replace("I don't remember", np.nan)
survey['n_credits'] = survey['n_credits'].replace({
    "I'm not sure yet": np.nan,
    "2 - underloading": "2"
})
survey['n_credits'] = pd.to_numeric(survey['n_credits'])
survey| student_id | n_credits | |
|---|---|---|
| 0 | 273674.0 | 4.0 |
| 1 | 298765.0 | 4.5 |
| 2 | 287129.0 | NaN |
| 3 | NaN | 2.0 |
Cleaning data – alternative
Recap: Type coercion
If variables in a DataFrame have multiple types of values, Python will coerce them into a single type, which may or may not be what you want.
If what Python does by default is not what you want, you can use explicit coercion functions like
pd.to_numeric(),astype(), etc., to turn them into the types you want them to be, which will generally also involve cleaning up the features of the data that caused the unwanted implicit coercion in the first place.
Aesthetic mappings
loan50 example DataFrame
| state | emp_length | term | homeownership | annual_income | verified_income | debt_to_income | total_credit_limit | total_credit_utilized | num_cc_carrying_balance | loan_purpose | loan_amount | grade | interest_rate | public_record_bankrupt | loan_status | has_second_income | total_income | |
|---|---|---|---|---|---|---|---|---|---|---|---|---|---|---|---|---|---|---|
| 0 | NJ | 3.0 | 60 | rent | 59000.0 | Not Verified | 0.557525 | 95131 | 32894 | 8 | debt_consolidation | 22000 | B | 10.90 | 0 | Current | False | 59000.0 |
| 1 | CA | 10.0 | 36 | rent | 60000.0 | Not Verified | 1.305683 | 51929 | 78341 | 2 | credit_card | 6000 | B | 9.92 | 1 | Current | False | 60000.0 |
| 2 | SC | NaN | 36 | mortgage | 75000.0 | Verified | 1.056280 | 301373 | 79221 | 14 | debt_consolidation | 25000 | E | 26.30 | 0 | Current | False | 75000.0 |
| 3 | CA | 0.0 | 36 | rent | 75000.0 | Not Verified | 0.574347 | 59890 | 43076 | 10 | credit_card | 6000 | B | 9.92 | 0 | Current | False | 75000.0 |
| 4 | OH | 4.0 | 60 | mortgage | 254000.0 | Not Verified | 0.238150 | 422619 | 60490 | 2 | home_improvement | 25000 | B | 9.43 | 0 | Current | False | 254000.0 |
Aesthetic mappings
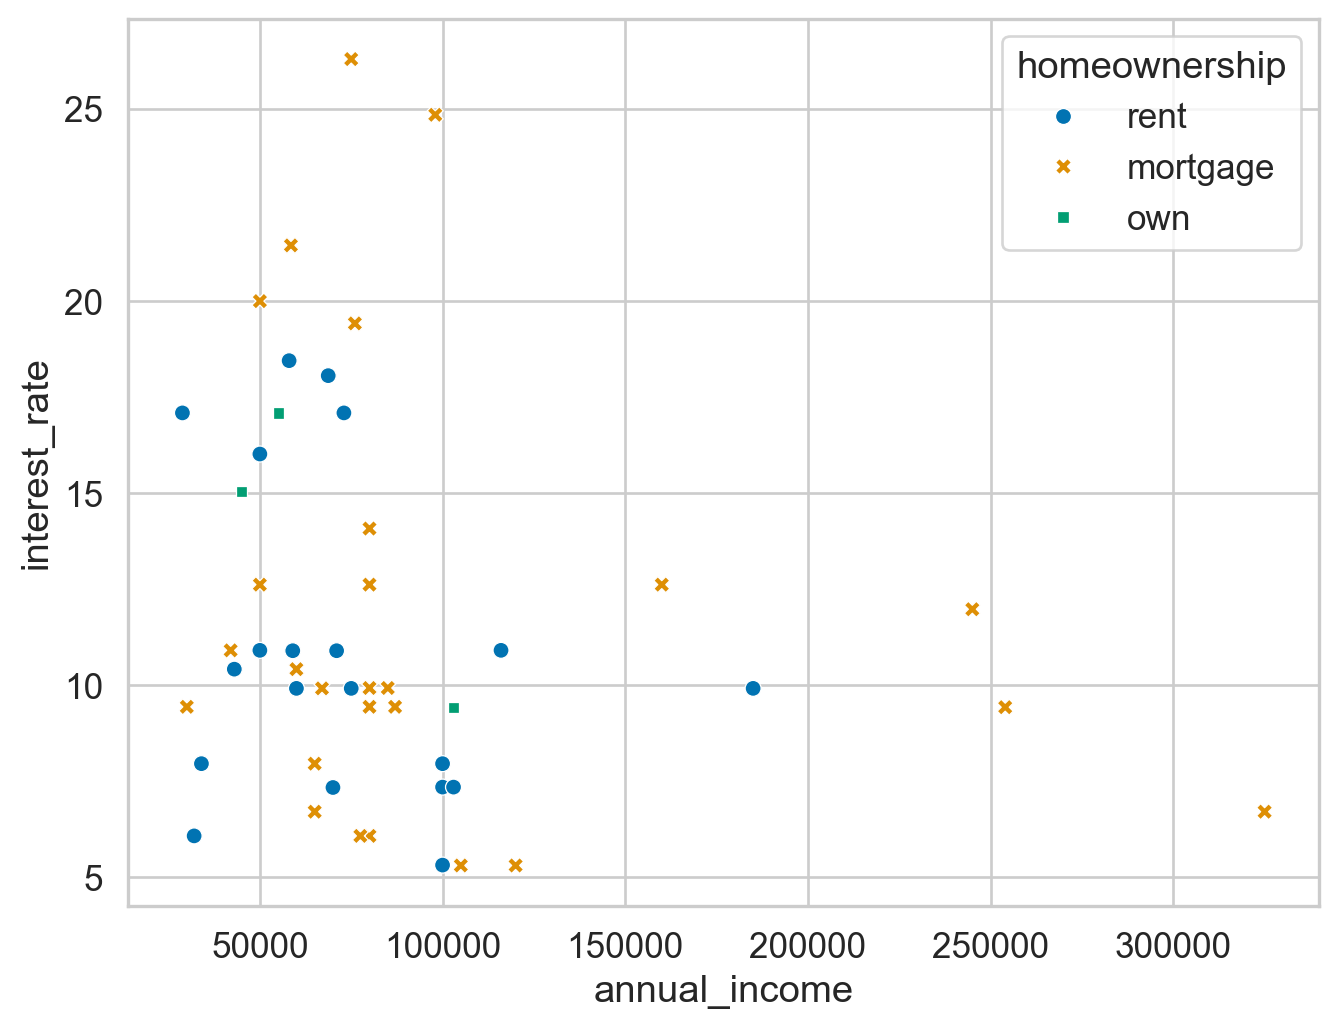
What will the following code result in?
Aesthetic mappings
Multiple plot layers
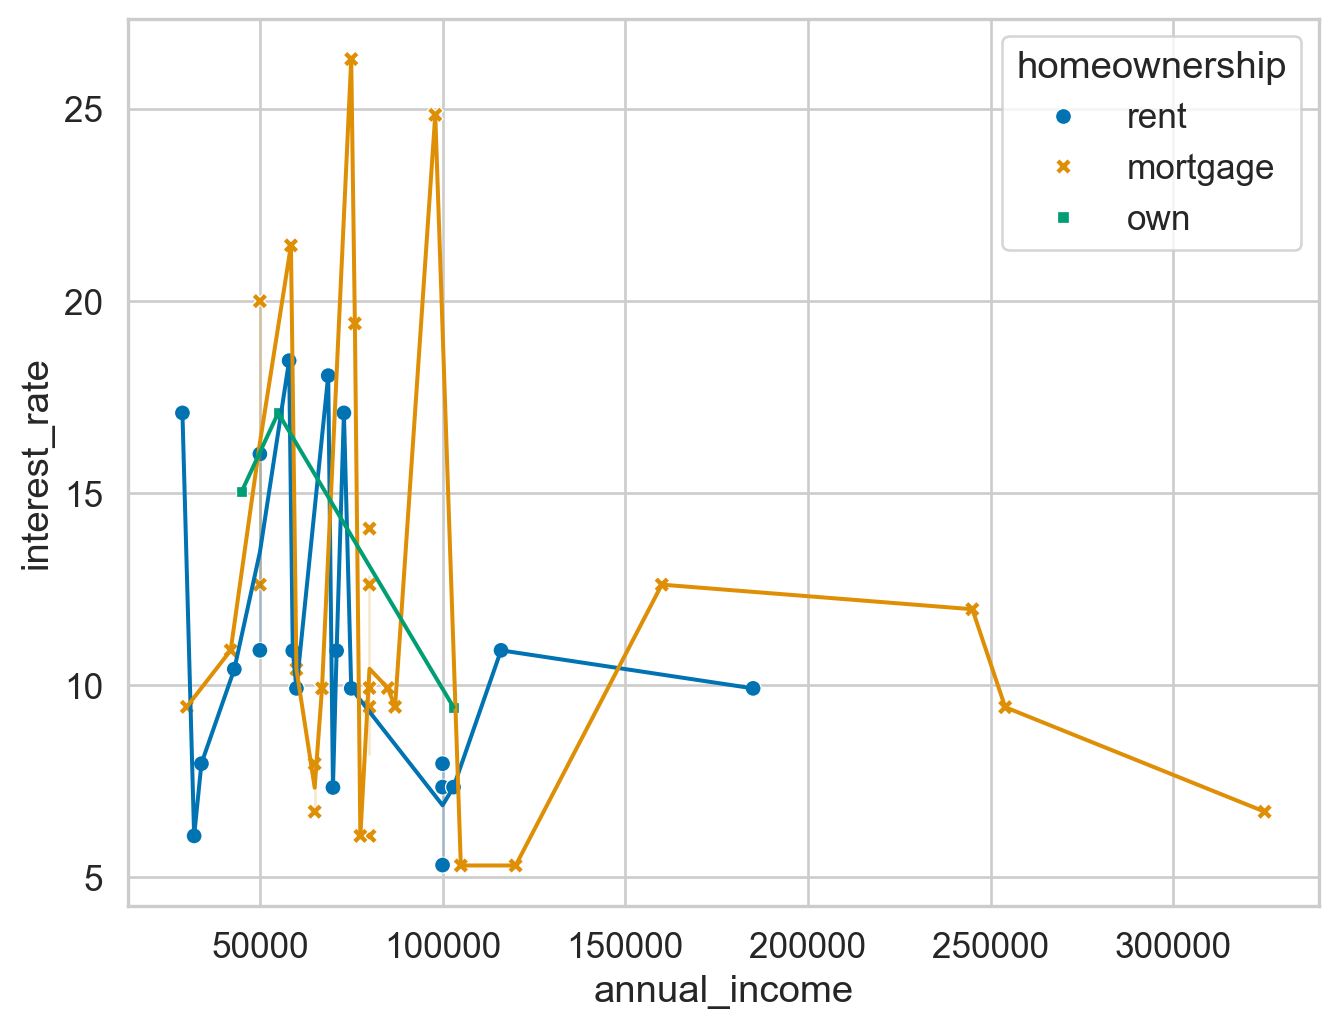
What will the following code result in?
Multiple plot layers
Mapping vs. setting
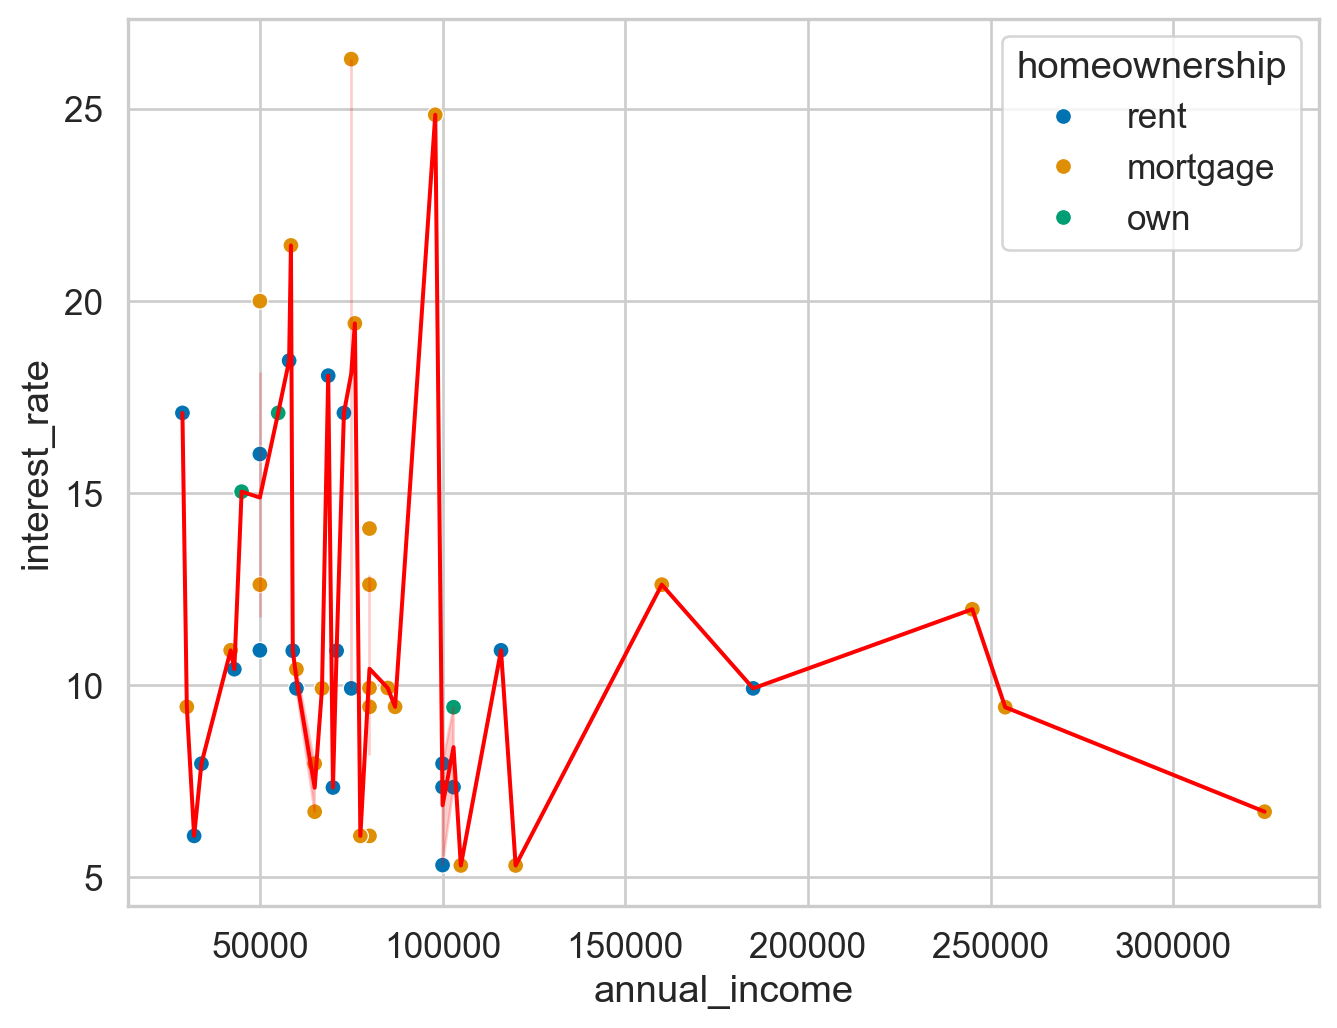
What will the following code result in?
Mapping vs. setting
Recap: Aesthetic mappings
Aesthetic mapping defined at the local level will be used only by the elements they’re defined for.
Setting colors produces a manual color aesthetic, while mapping assigns colors automatically based on the qualifier.
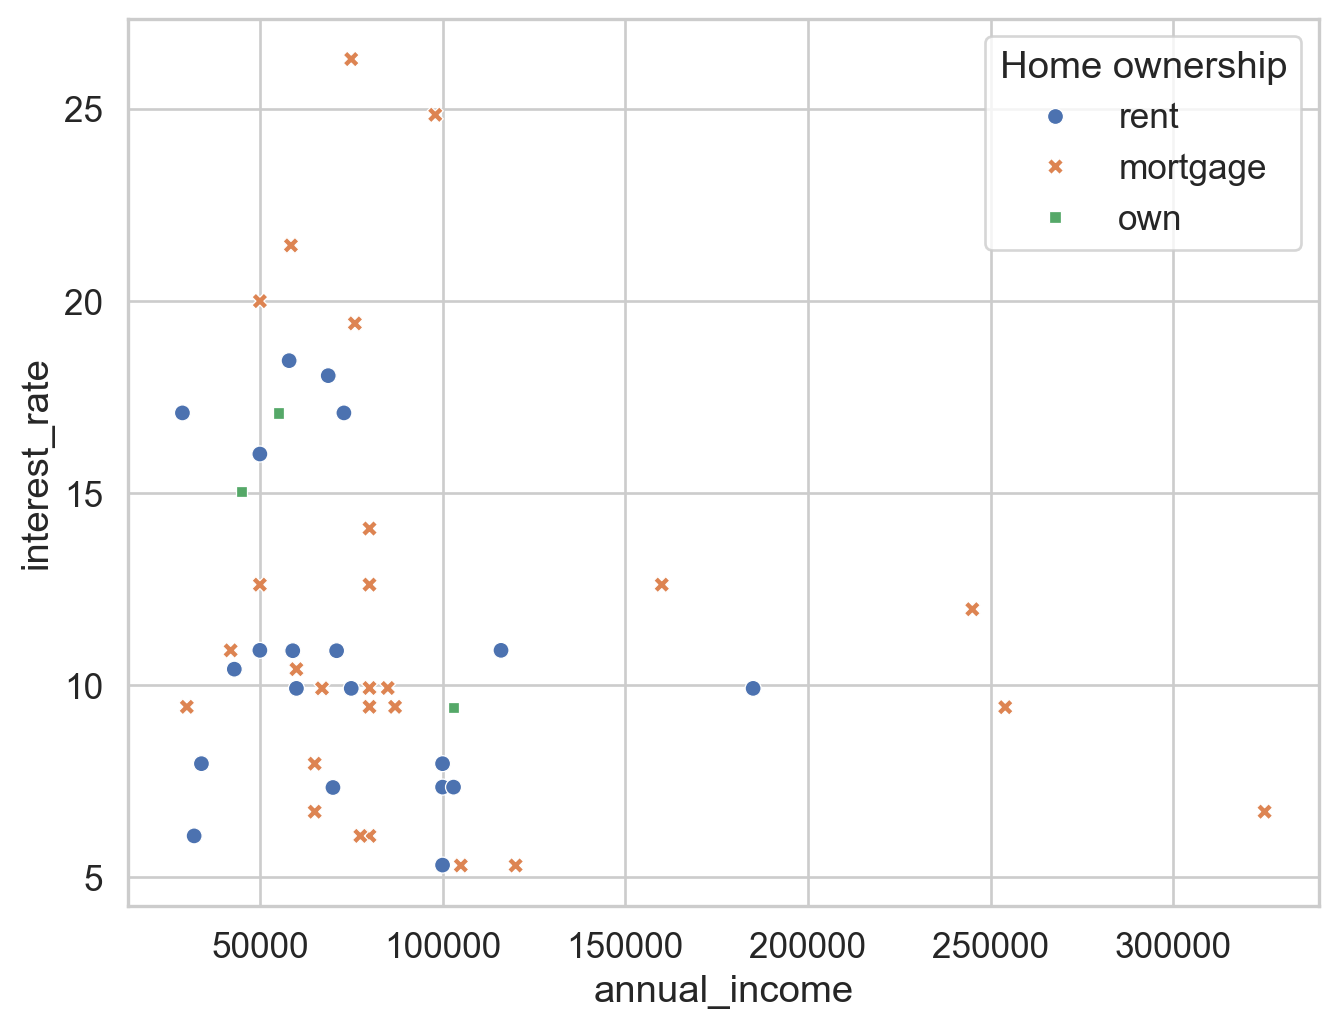
Aside: Legends
Categories
Categorical
- Categorical variables — variables that have a fixed and known set of possible values — are used in the pandas library.
- They are also useful when you want to display character vectors in a non-alphabetical order.
Bar plot
Bar plot - reordered
Frequency table
Under the hood
0         rent
1         rent
2     mortgage
3         rent
4     mortgage
5     mortgage
6         rent
7     mortgage
8         rent
9     mortgage
10        rent
11    mortgage
12        rent
13    mortgage
14        rent
15    mortgage
16        rent
17        rent
18        rent
19    mortgage
20    mortgage
21    mortgage
22    mortgage
23        rent
24    mortgage
25        rent
26    mortgage
27         own
28    mortgage
29    mortgage
30        rent
31    mortgage
32    mortgage
33        rent
34        rent
35         own
36    mortgage
37        rent
38    mortgage
39        rent
40    mortgage
41        rent
42        rent
43    mortgage
44    mortgage
45    mortgage
46    mortgage
47        rent
48         own
49    mortgage
Name: homeownership, dtype: category
Categories (3, object): ['mortgage', 'rent', 'own']
Recap: Categorical
The
pandas.Categoricaltype is useful for dealing with categorical data and their levels.Factors and the order of their levels are relevant for displays (tables, plots) and they’ll be relevant for modeling (later in the course).
Categoricalis a data class in pandas.


