Visualizing various types of data
Lecture 5
University of Arizona
INFO 511
Setup
Data Visualization
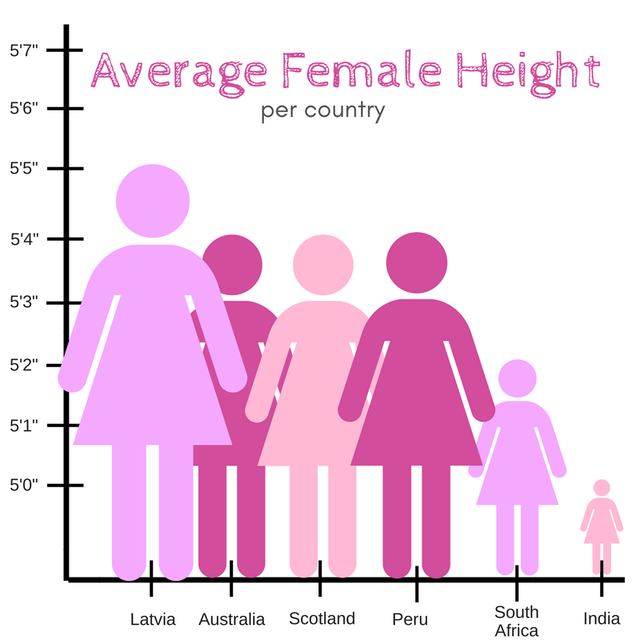
Examining data visualization
Discuss the following for the visualization in the #lecture-discussions Slack Channel.
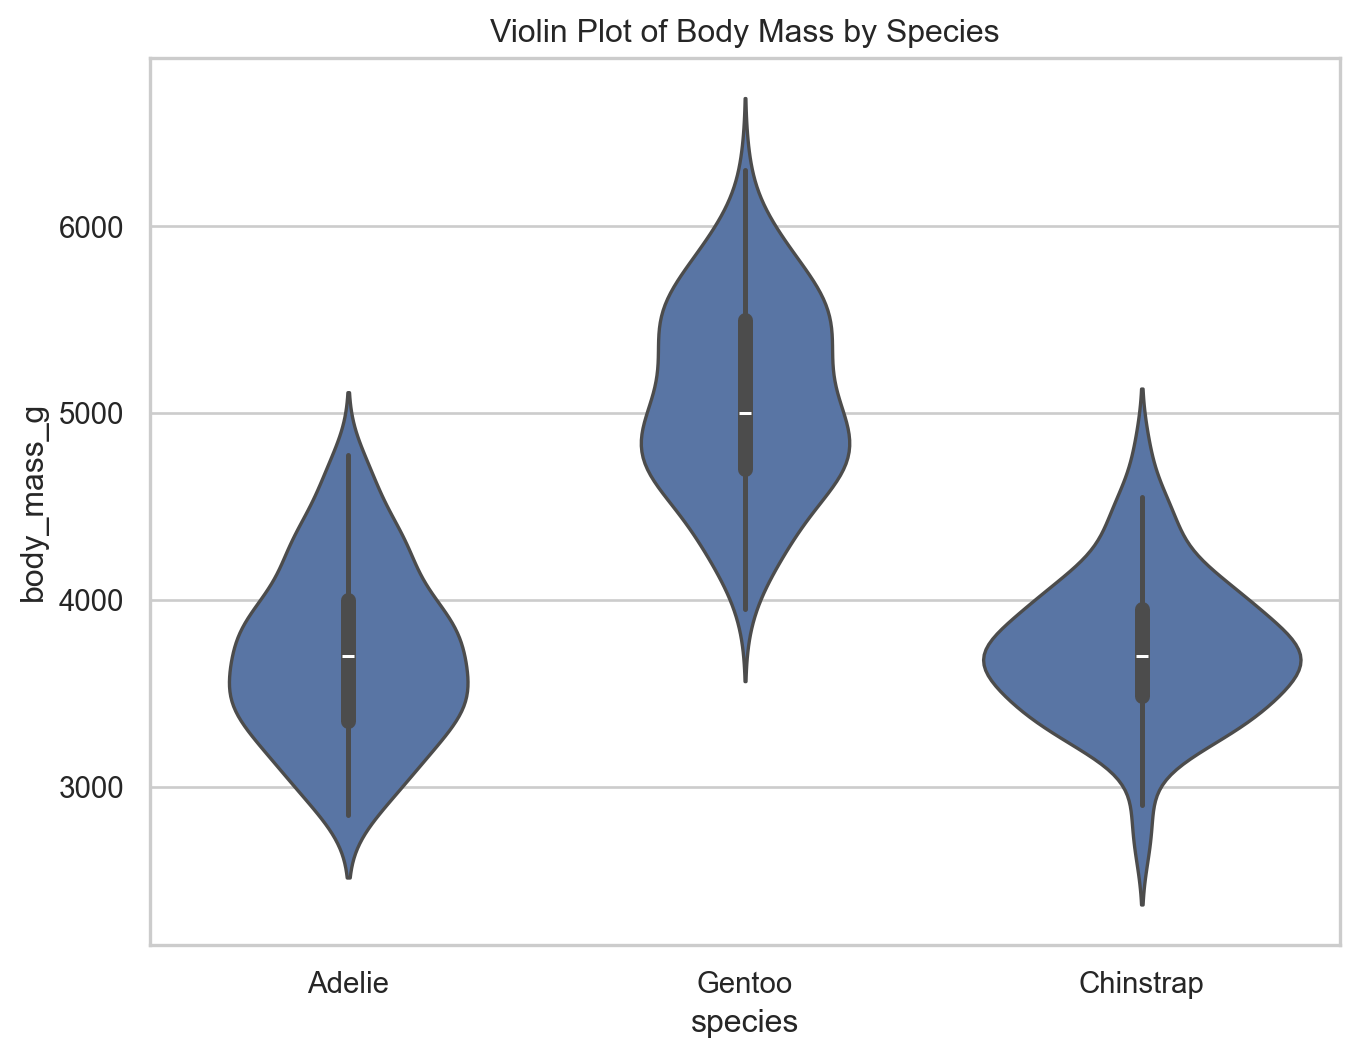
Violin plots
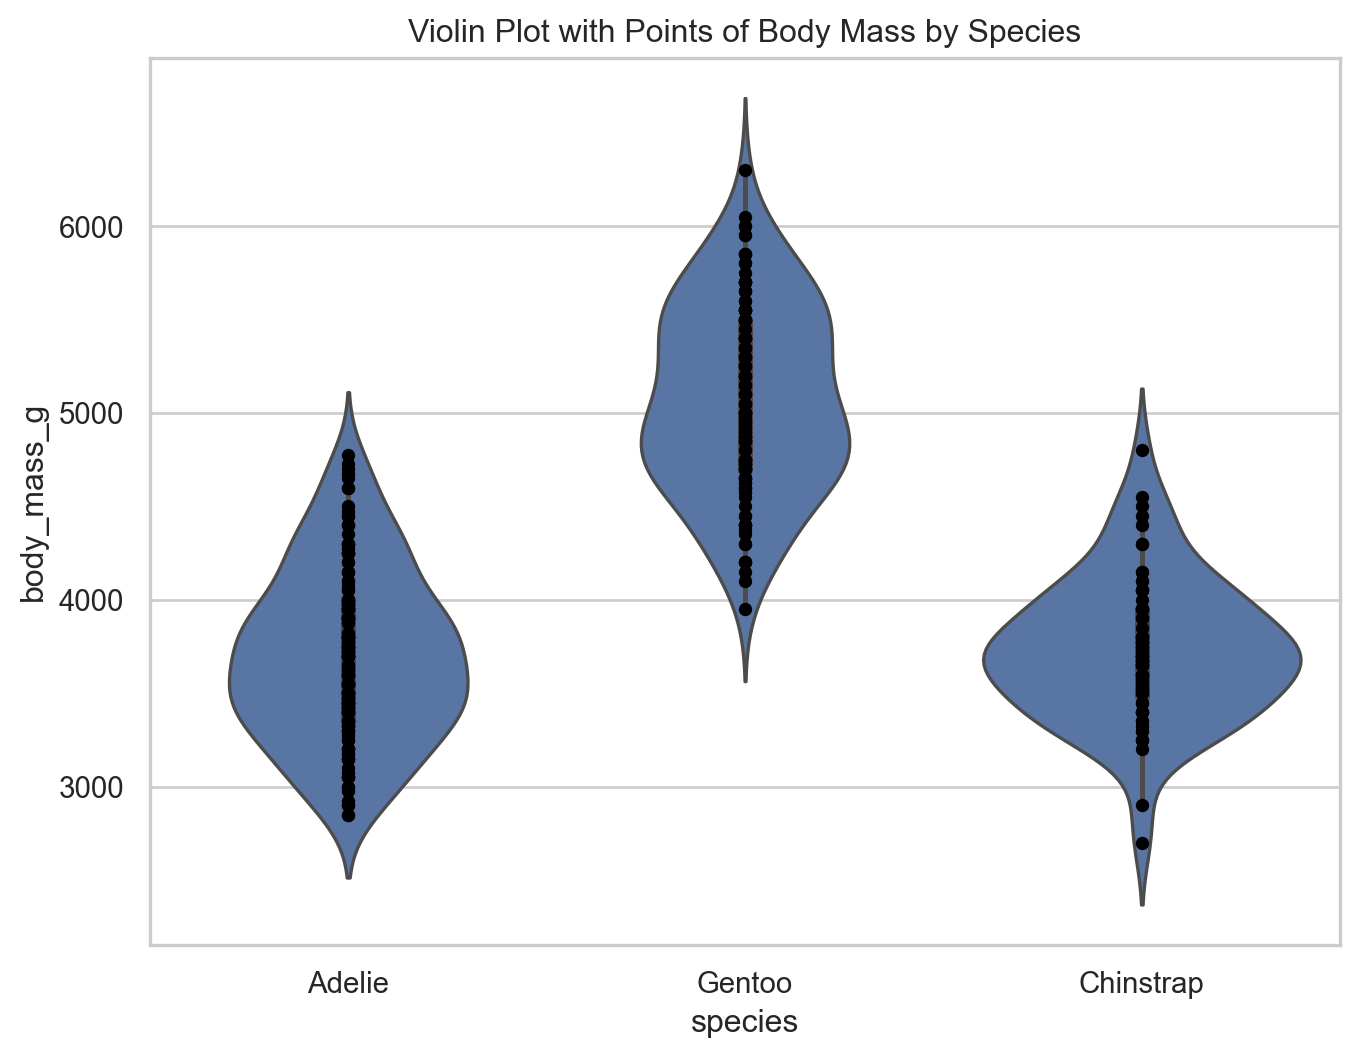
Multiple geoms
Multiple geoms
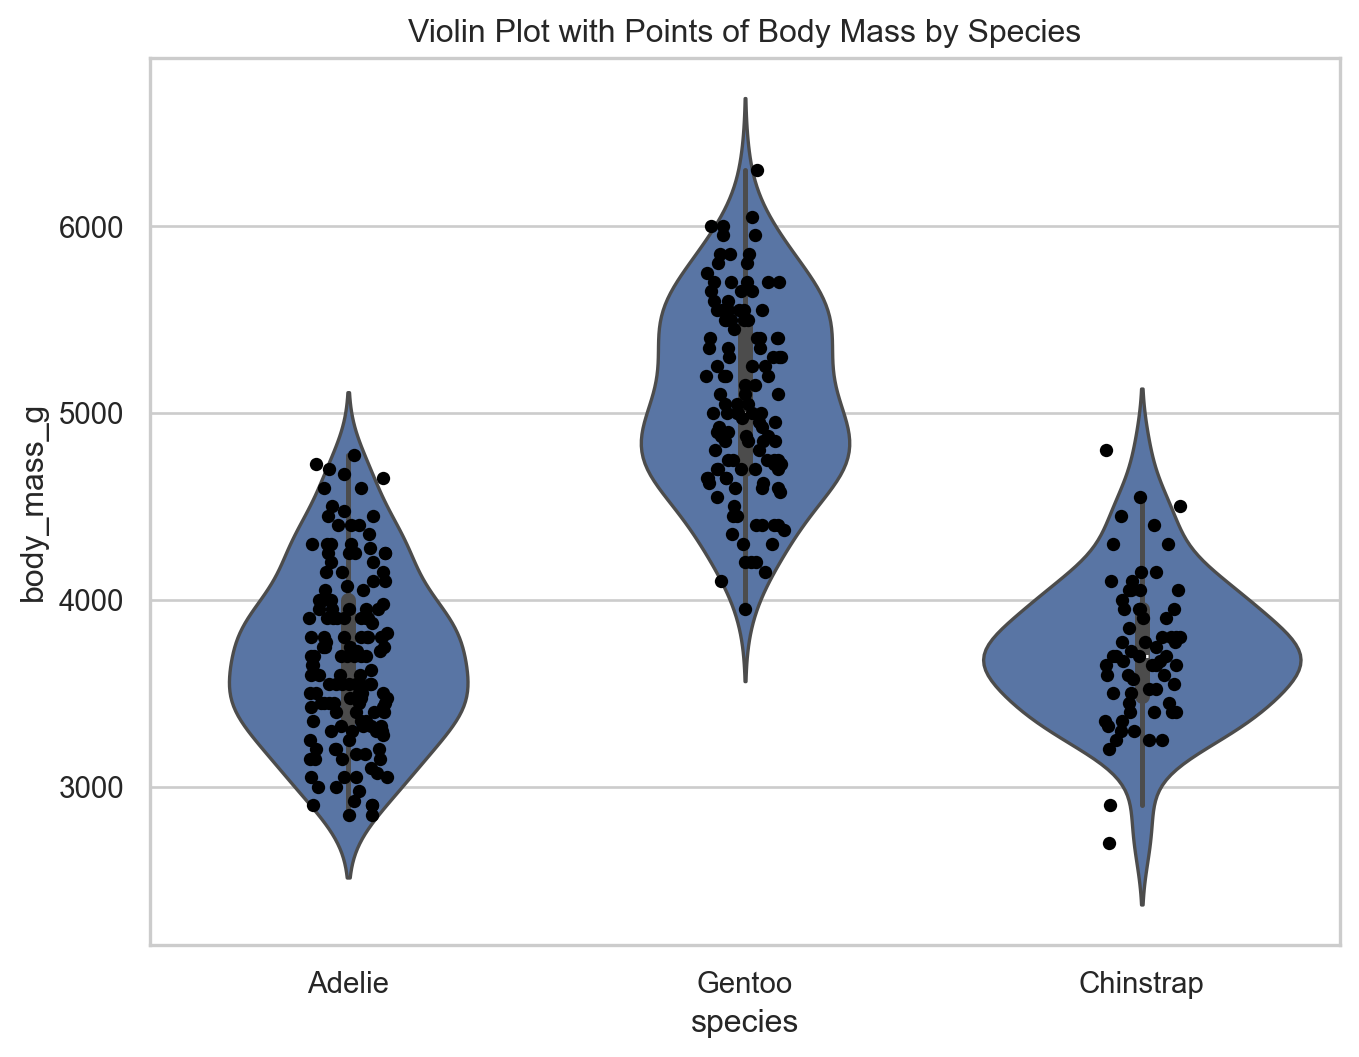
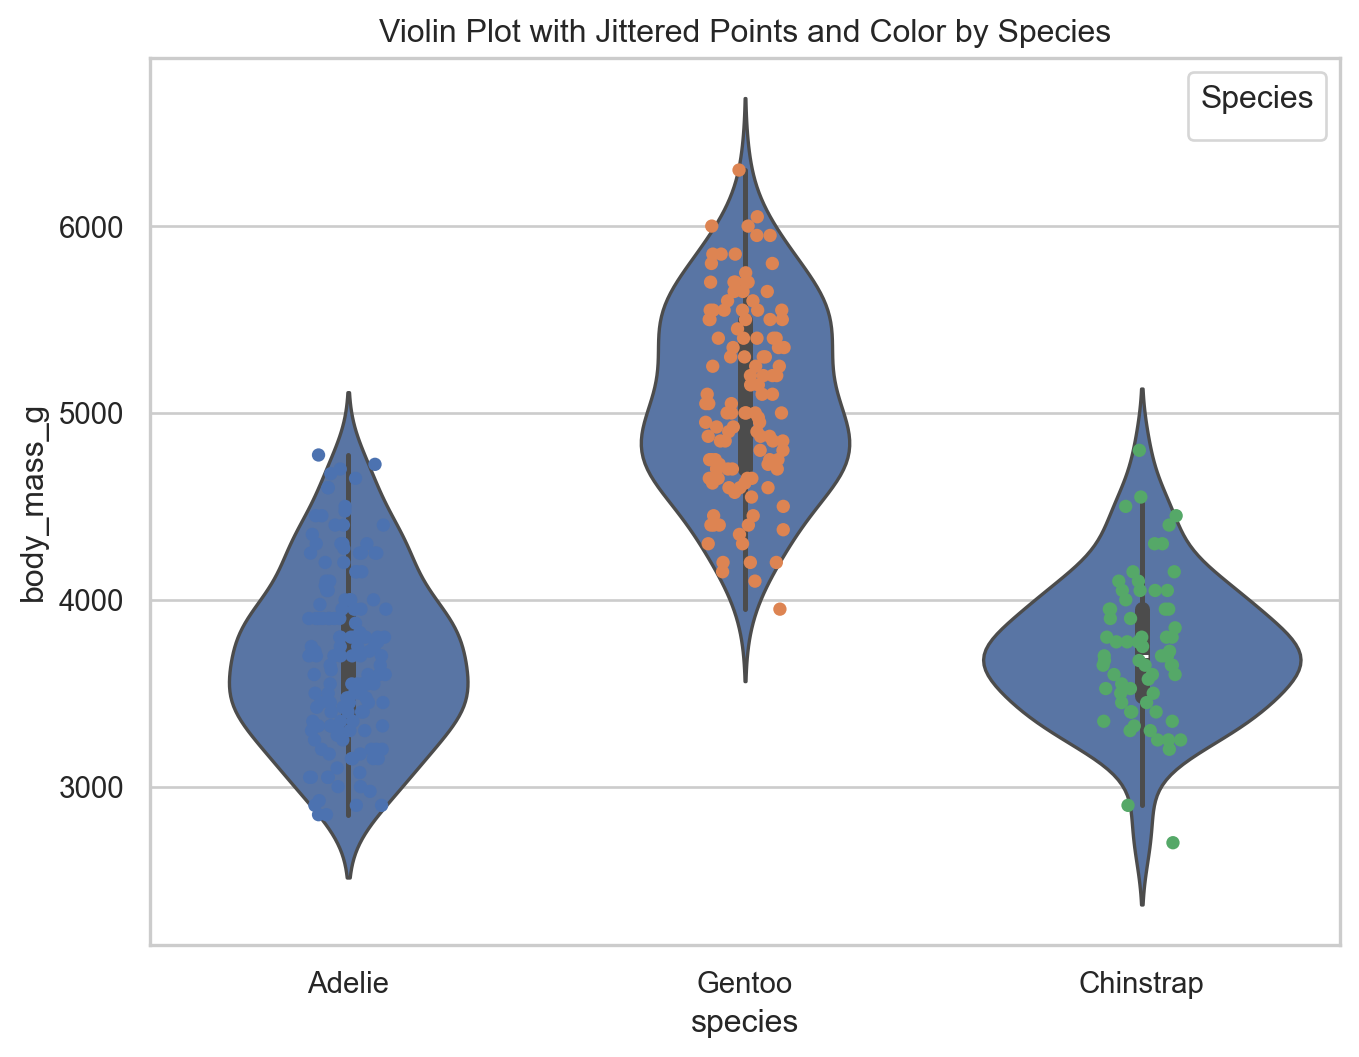
Multiple geoms + aesthetics
Multiple geoms + aesthetics
Code
plt.figure(figsize=(8, 6))
sns.violinplot(x="species", y="body_mass_g", data=penguins)
sns.stripplot(x="species", y="body_mass_g", data=penguins, jitter=True, hue='species')
plt.title('Violin Plot with Jittered Points, Color by Species, and No Legend')
plt.legend(title='Species').remove()
plt.show()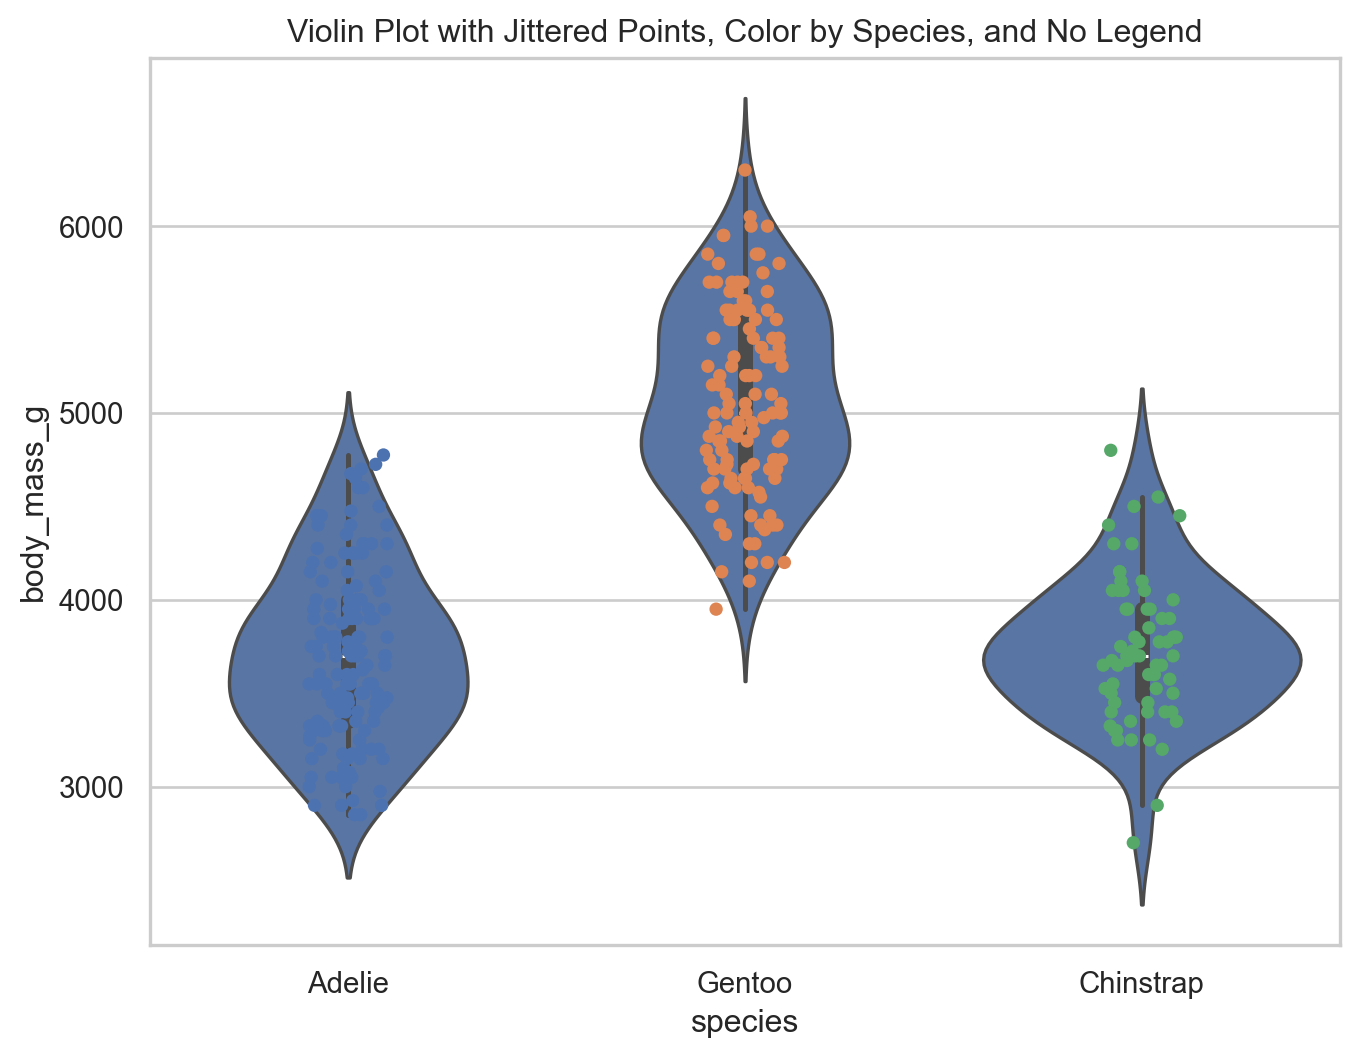
Multiple geoms + aesthetics
Code
plt.figure(figsize=(8, 6))
sns.violinplot(x="species", y="body_mass_g", data=penguins, palette='colorblind')
sns.stripplot(x="species", y="body_mass_g", data=penguins, jitter=True, hue='species', palette='colorblind')
plt.title('Violin Plot with Jittered Points, Color by Species, No Legend, and Colorblind Palette')
plt.legend(title='Species').remove()
plt.show()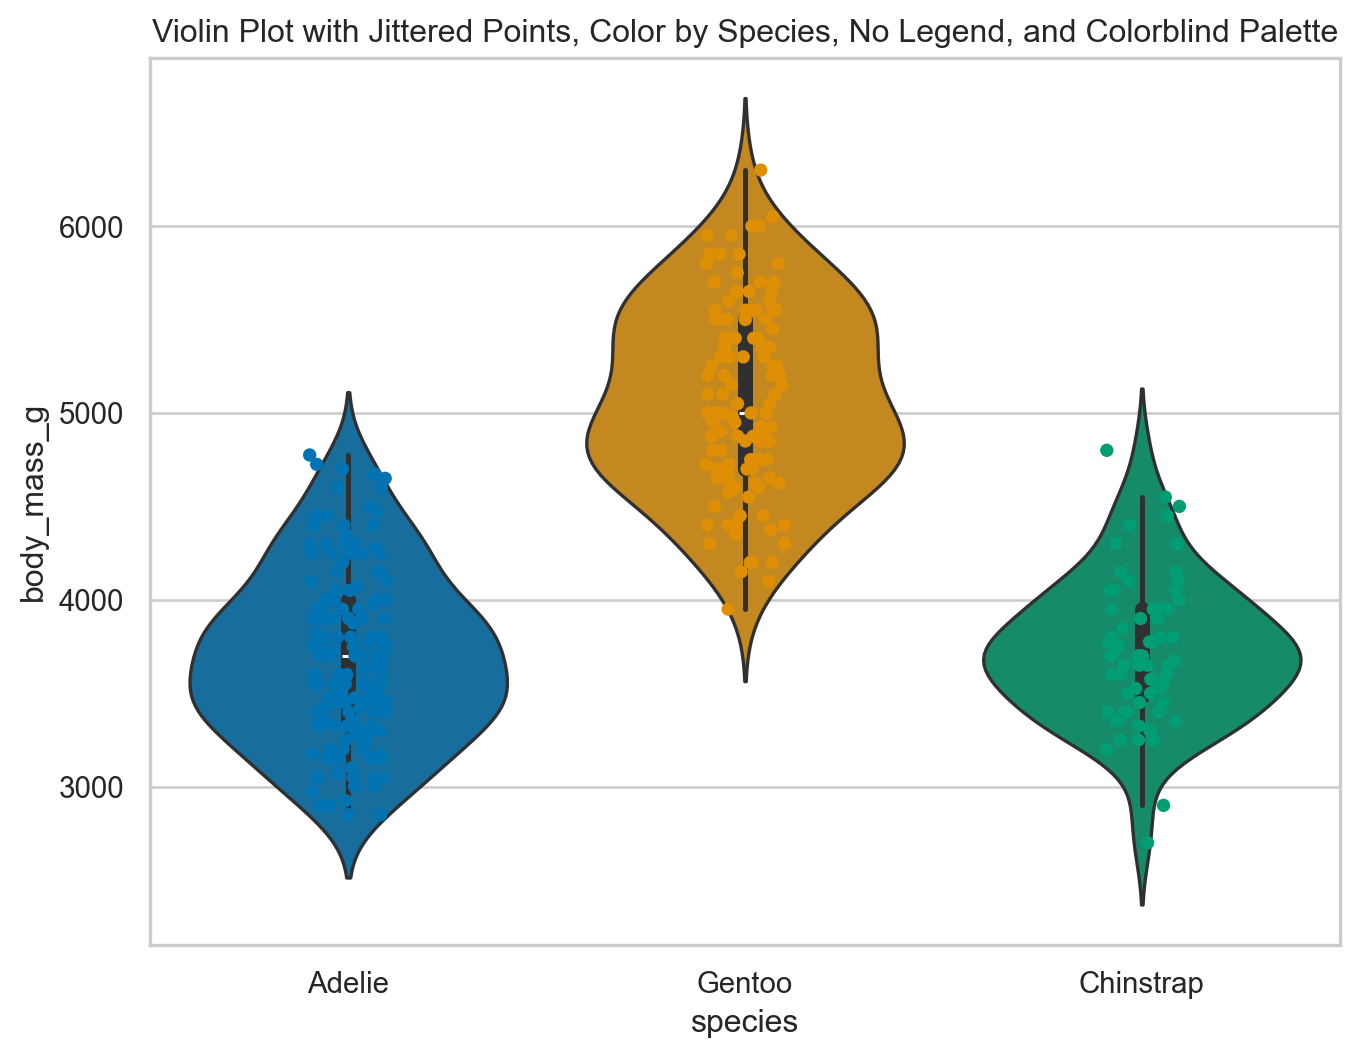
Visualizing various types of data
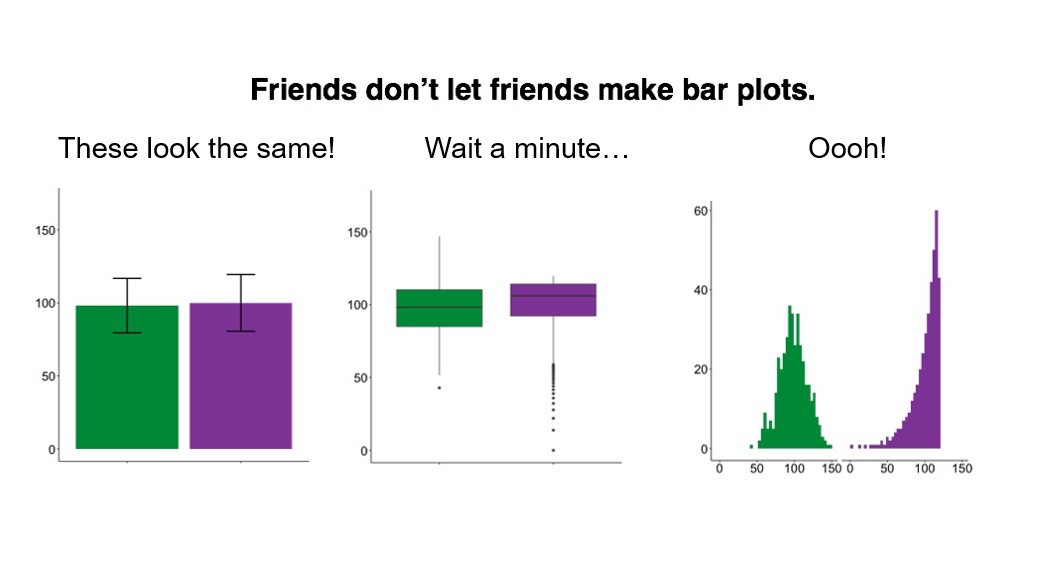
The way data is displayed matters
What do these three plots show?
Visualizing penguins
import pandas as pd
import seaborn as sns
import matplotlib.pyplot as plt
from palmerpenguins import load_penguins

penguins = load_penguins()

penguins.head()| species | island | bill_length_mm | bill_depth_mm | flipper_length_mm | body_mass_g | sex | year | |
|---|---|---|---|---|---|---|---|---|
| 0 | Adelie | Torgersen | 39.1 | 18.7 | 181.0 | 3750.0 | male | 2007 |
| 1 | Adelie | Torgersen | 39.5 | 17.4 | 186.0 | 3800.0 | female | 2007 |
| 2 | Adelie | Torgersen | 40.3 | 18.0 | 195.0 | 3250.0 | female | 2007 |
| 3 | Adelie | Torgersen | NaN | NaN | NaN | NaN | NaN | 2007 |
| 4 | Adelie | Torgersen | 36.7 | 19.3 | 193.0 | 3450.0 | female | 2007 |

Univariate analysis
Univariate analysis
Analyzing a single variable:
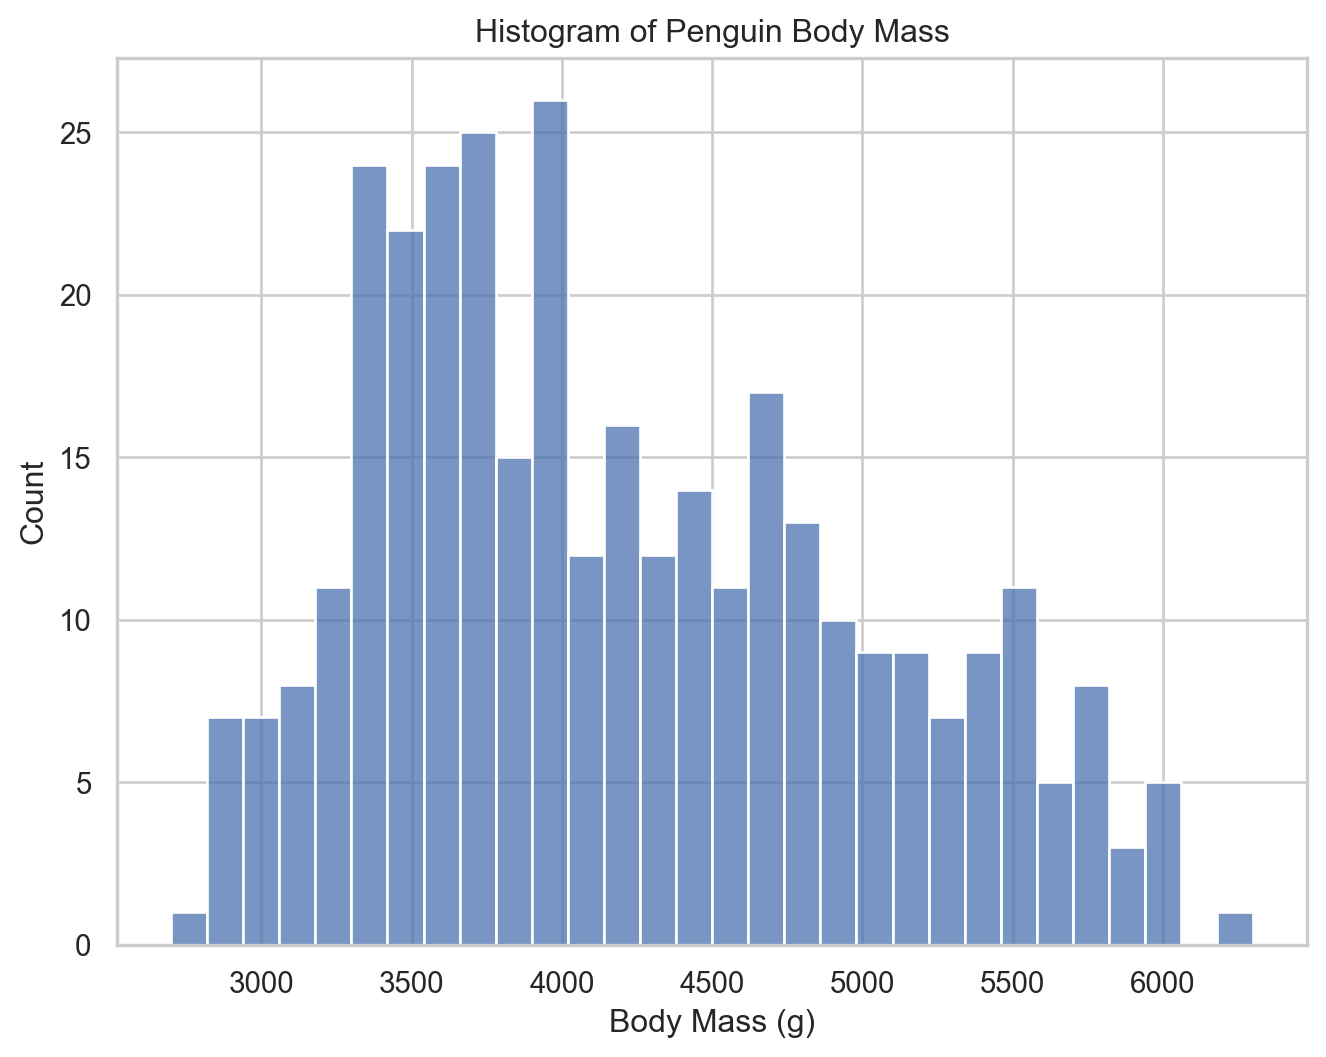
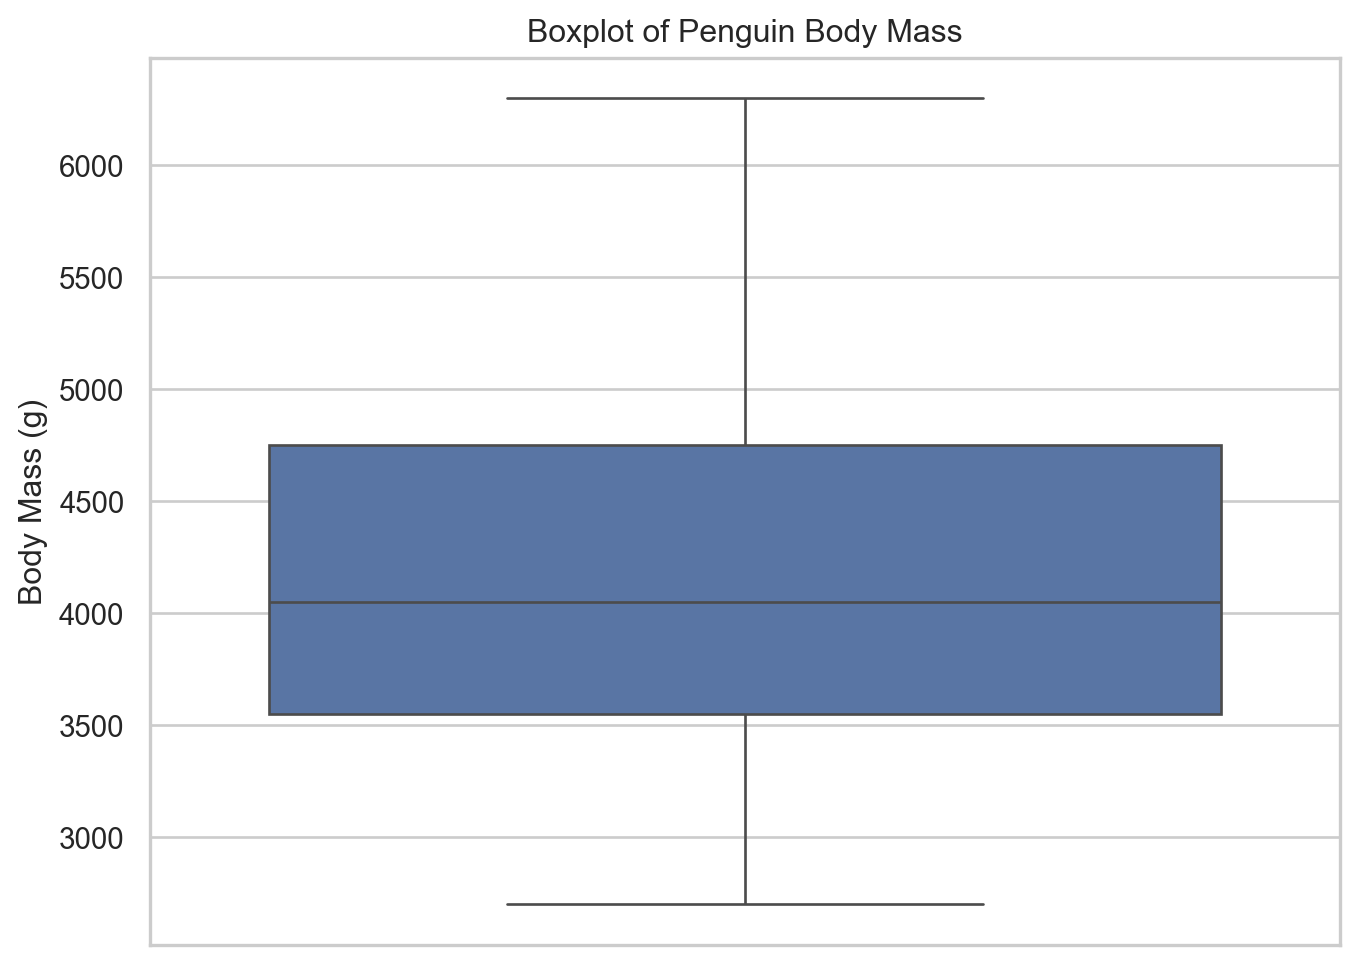
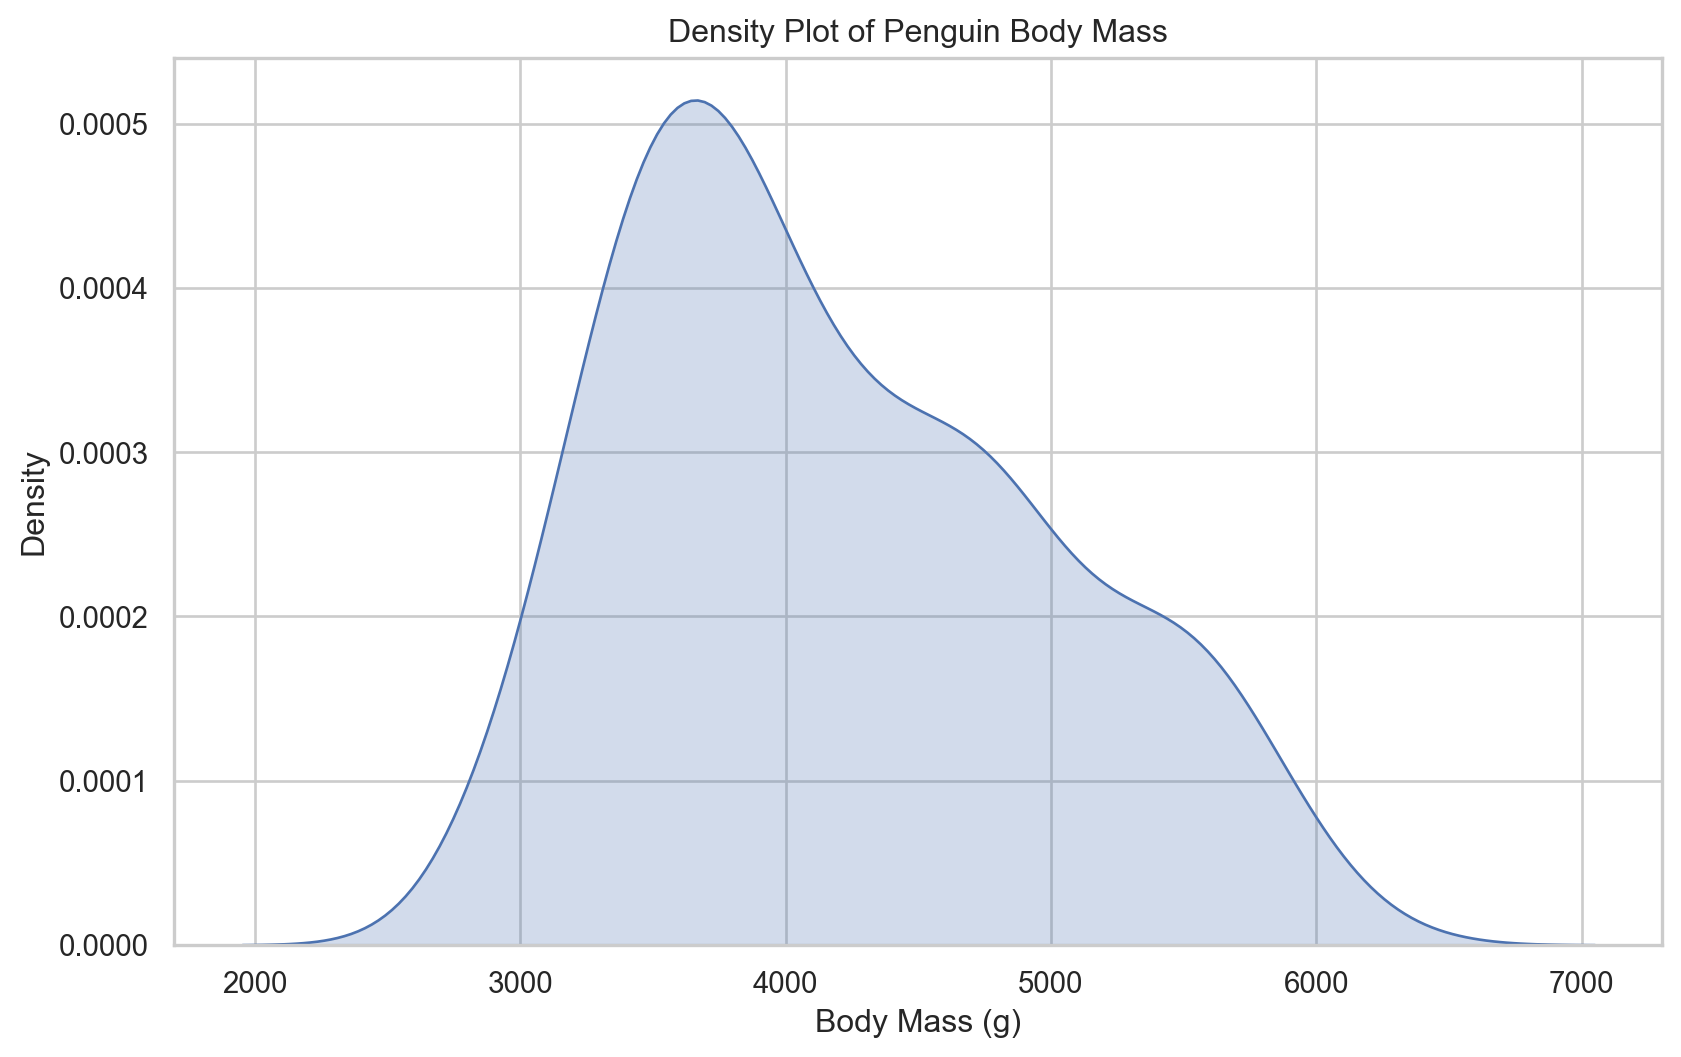
Numerical: histogram, box plot, density plot, etc.
Categorical: bar plot, pie chart, etc.
Histogram
Boxplot
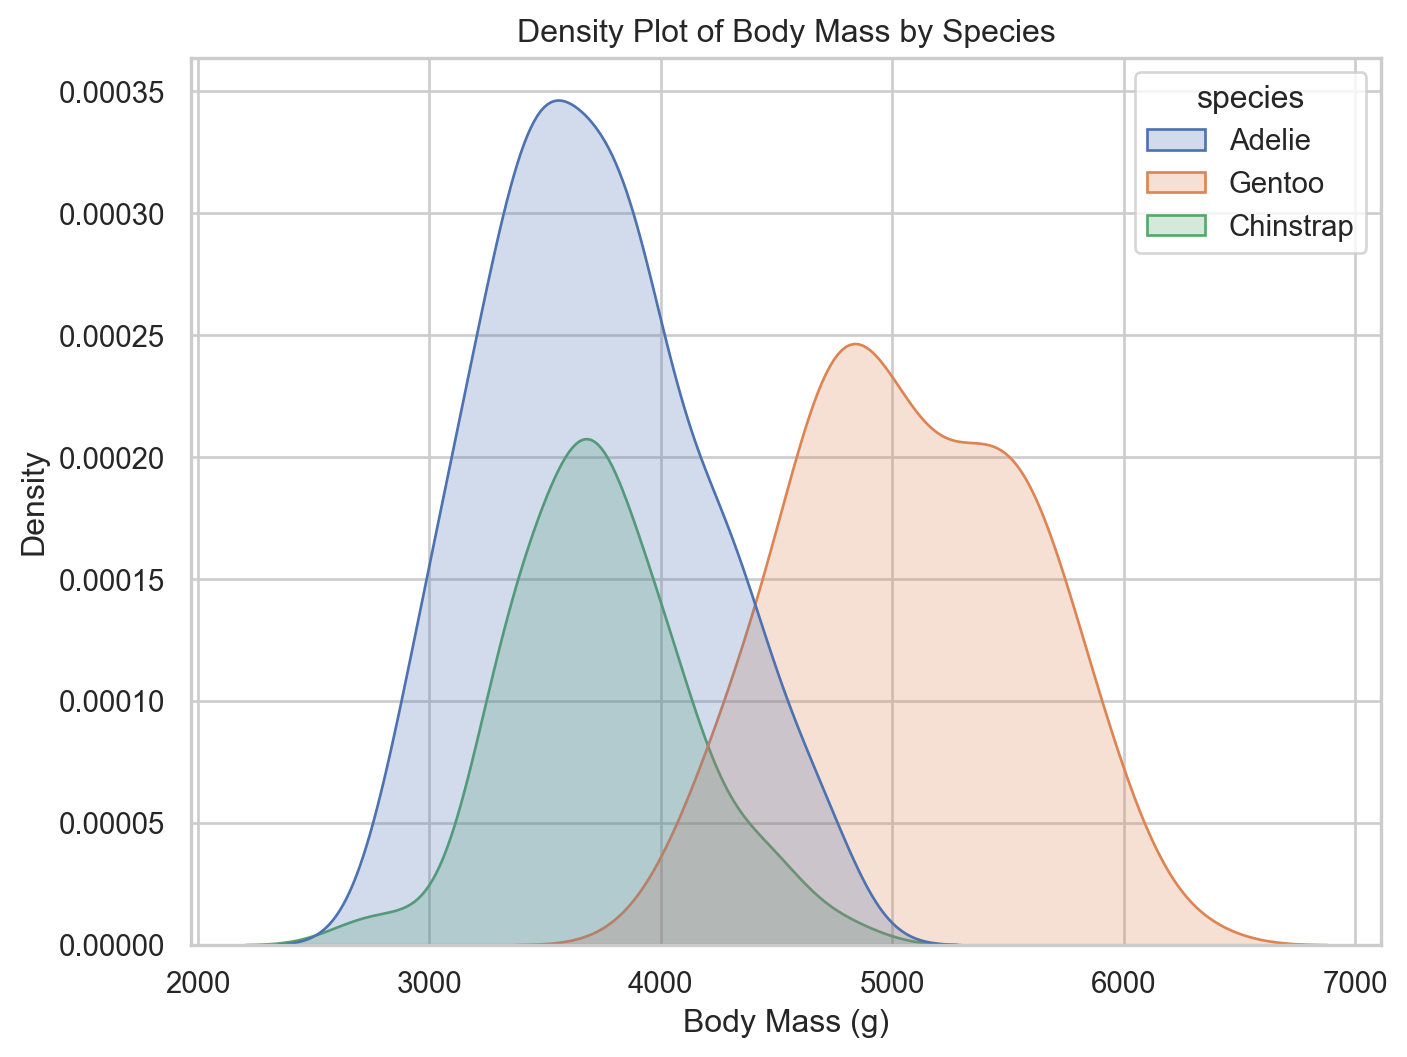
Density plot
Bivariate analysis
Bivariate analysis
Analyzing the relationship between two variables:
Numerical + numerical: scatterplot
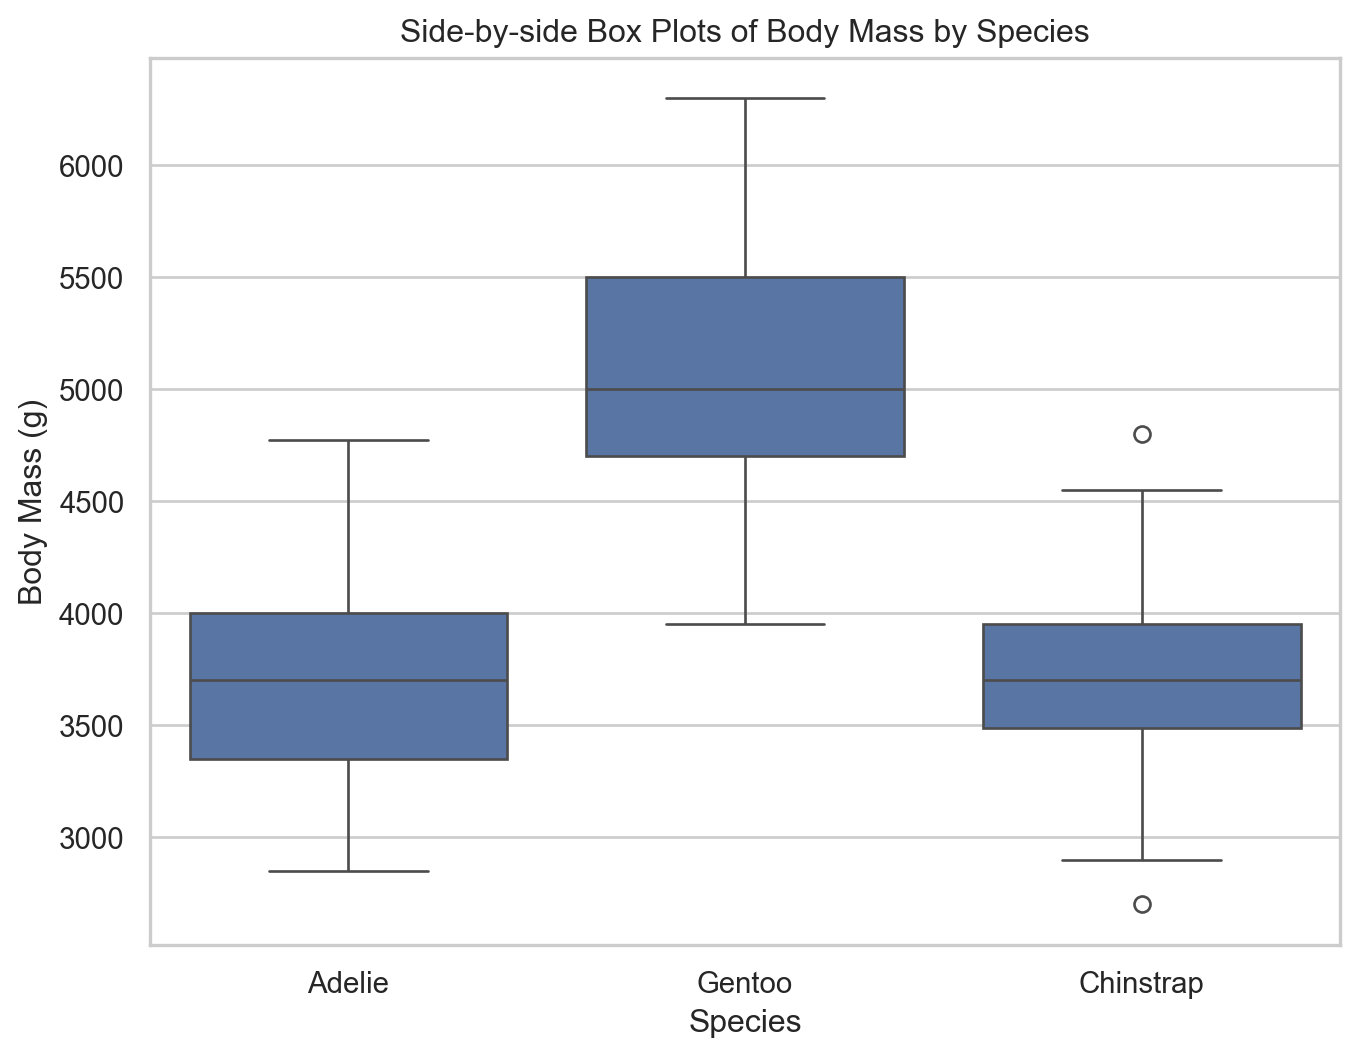
Numerical + categorical: side-by-side box plots, violin plots, etc.
Categorical + categorical: stacked bar plots
Using an aesthetic (e.g., fill, color, shape, etc.) or facets to represent the second variable in any plot
Side-by-side box plots
Density plots
Multivariate analysis
Bechdel Test
The Bechdel test also known as the Bechdel-Wallace test, is a measure of the representation of women in film and other fiction. The test asks whether a work features at least two female characters who have a conversation about something other than a man. Some versions of the test also require that those two female characters have names.

Load Bechdel test data
Load the Bechdel test data with pd.read_csv()
list() the .columns names of the bechdel data:
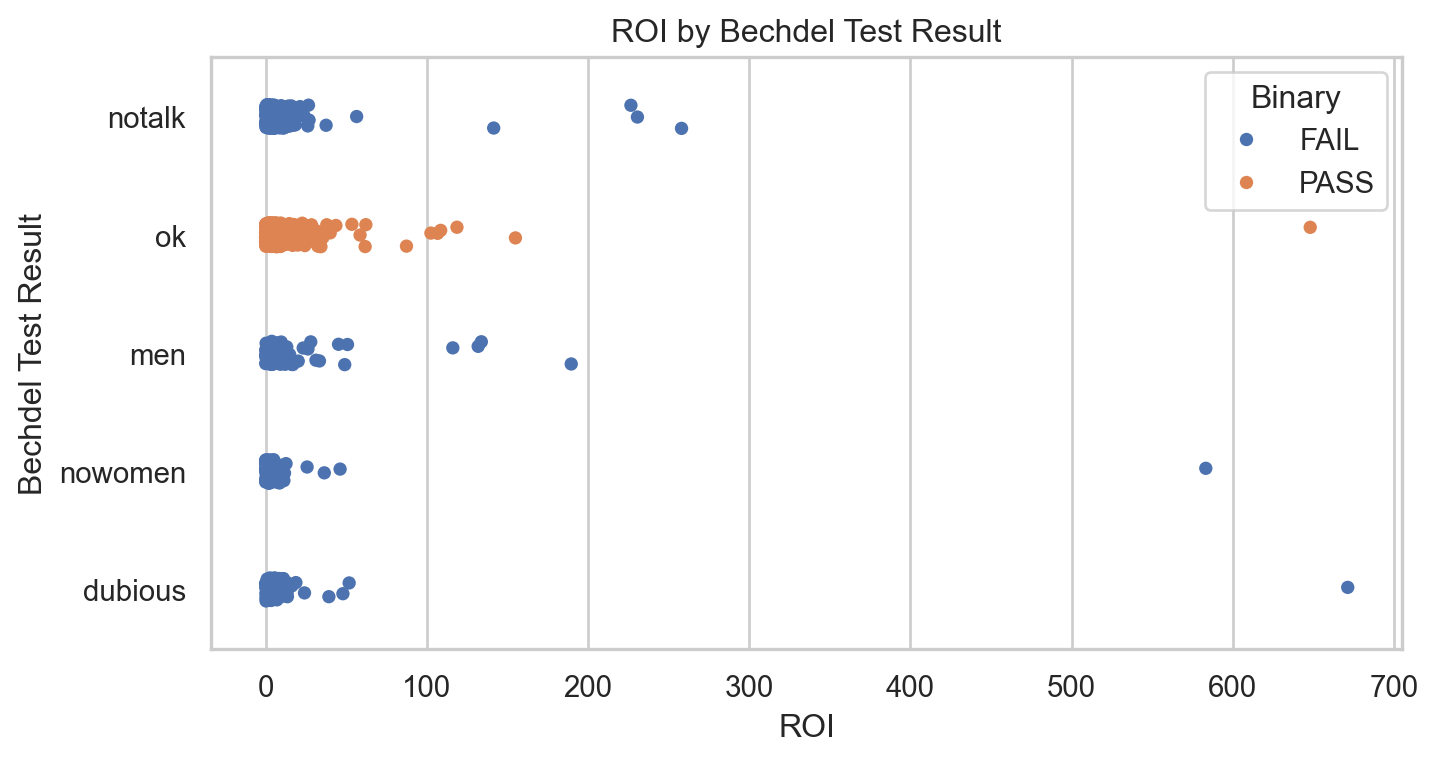
ROI by test result
What about this plot makes it difficult to evaluate how ROI varies by Bechdel test result?
Movies with high ROI
What are the movies with highest ROI?
high_roi_movies = bechdel[bechdel['roi'] > 400][['title', 'roi', 'budget_2013', 'gross_2013', 'year', 'clean_test']]
print(high_roi_movies)
title roi budget_2013 gross_2013 year \
703 Paranormal Activity 671.336857 505595 339424558.0 2007
1319 The Blair Witch Project 648.065333 839077 543776715.0 1999
1575 El Mariachi 583.285665 11622 6778946.0 1992
clean_test
703 dubious
1319 ok
1575 nowomen ROI by test result
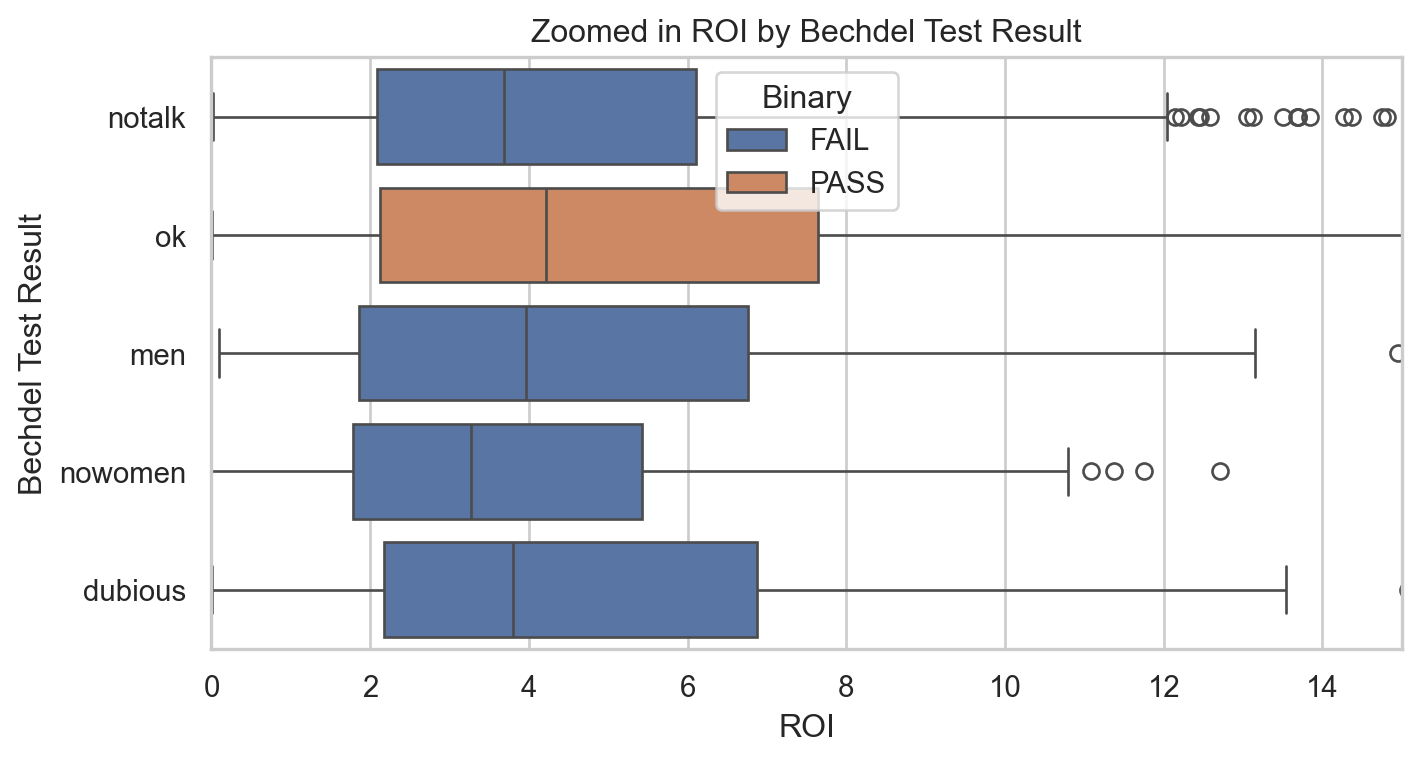
Zoom in: What about this plot makes it difficult to evaluate how ROI varies by Bechdel test result?
Sneak preview…
to next week’s data wrangling pipelines…
Median ROI
Median ROI by test result
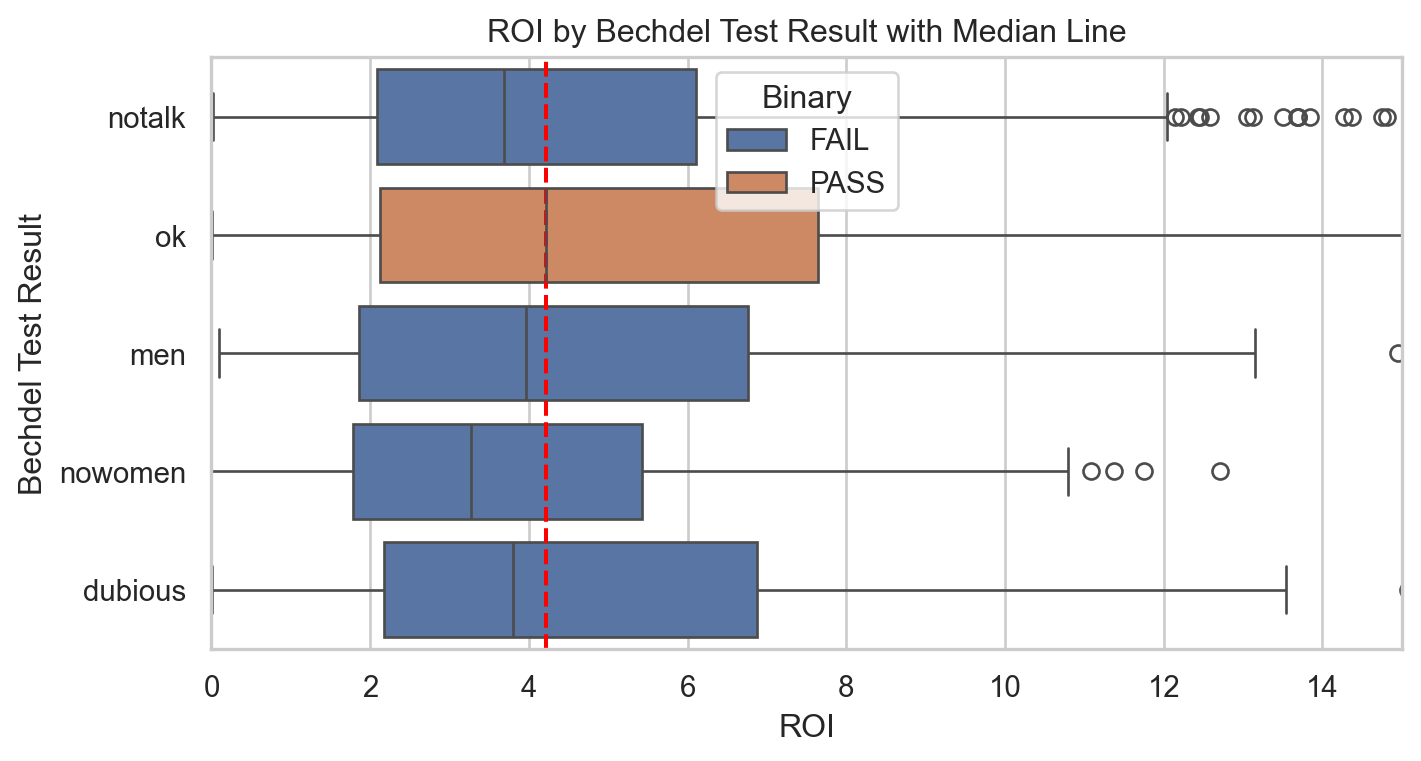
ROI by test result with median line
What does this plot say about return-on-investment on movies that pass the Bechdel test?
Code
plt.figure(figsize=(8, 4))
sns.boxplot(x='roi', y='clean_test', hue='binary', data=bechdel)
plt.axvline(x=4.21, color='red', linestyle='--')
plt.xlim(0, 15)
plt.title('ROI by Bechdel Test Result with Median Line')
plt.xlabel('ROI')
plt.ylabel('Bechdel Test Result')
plt.legend(title='Binary')
plt.show()